|
|
|
|
| ||||
|
|
|
|
|
|
|
|
|
|
10 |
8.04 |
10 |
9.14 |
10 |
7.46 |
8 |
6.58 |
|
8 |
6.95 |
8 |
8.14 |
8 |
6.77 |
8 |
5.76 |
|
13 |
7.58 |
13 |
8.74 |
13 |
12.74 |
8 |
7.71 |
|
9 |
8.81 |
9 |
8.77 |
9 |
7.11 |
8 |
8.84 |
|
11 |
8.33 |
11 |
9.26 |
11 |
7.81 |
8 |
8.47 |
|
14 |
9.96 |
14 |
8.10 |
14 |
8.84 |
8 |
7.04 |
|
6 |
7.24 |
6 |
6.13 |
6 |
6.08 |
8 |
5.25 |
|
4 |
4.26 |
4 |
3.10 |
4 |
5.39 |
19 |
12.50 |
|
12 |
10.84 |
12 |
9.13 |
12 |
8.15 |
8 |
5.56 |
|
7 |
4.82 |
7 |
7.26 |
7 |
6.42 |
8 |
7.91 |
|
5 |
5.68 |
5 |
4.74 |
5 |
5.73 |
8 |
6.89 |
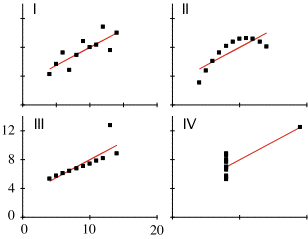
The four sets of data that make up the quartet are similar in many respects. For all four:
However, when the data are plotted, the differences among the data sets are revealed.

Numerical Recipes has a "robust" linear fitting routine called MEDFIT that is supposed to be less sensitive to outliers; it works by minimizing the absolute deviation of the data from the fit rather than the squared deviation. To test it, I fit lines to all four datasets in Anscombe's Quartet using both least-squares and MEDFIT. The results are below:
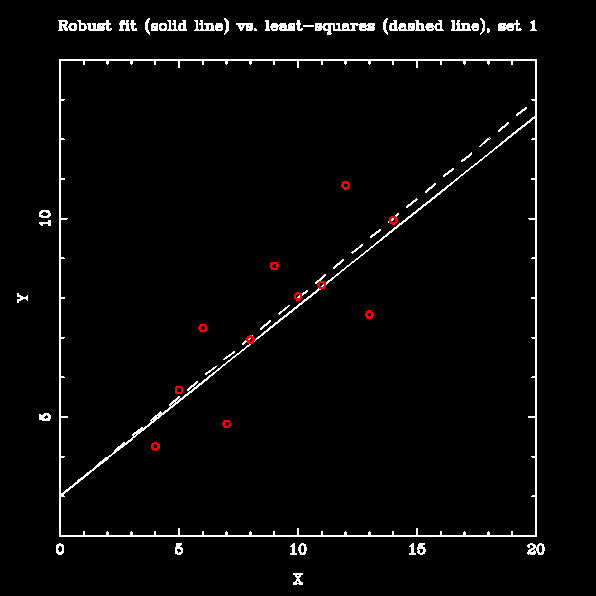
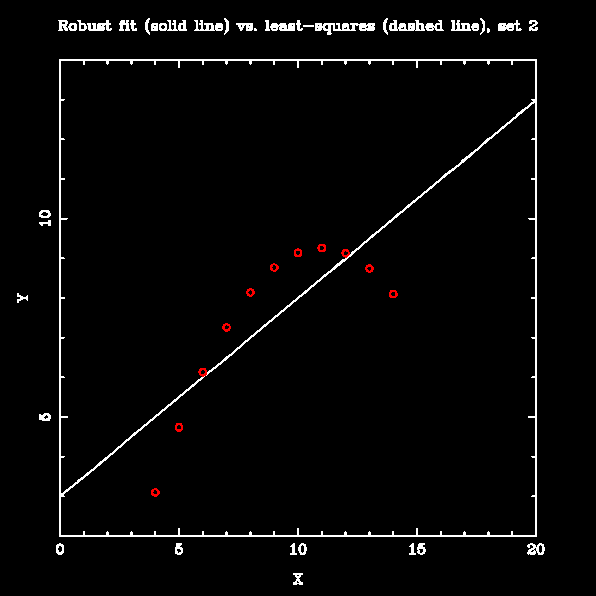
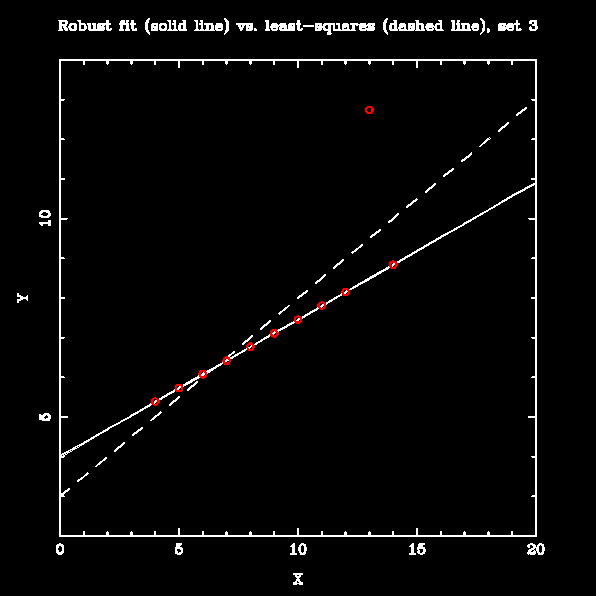
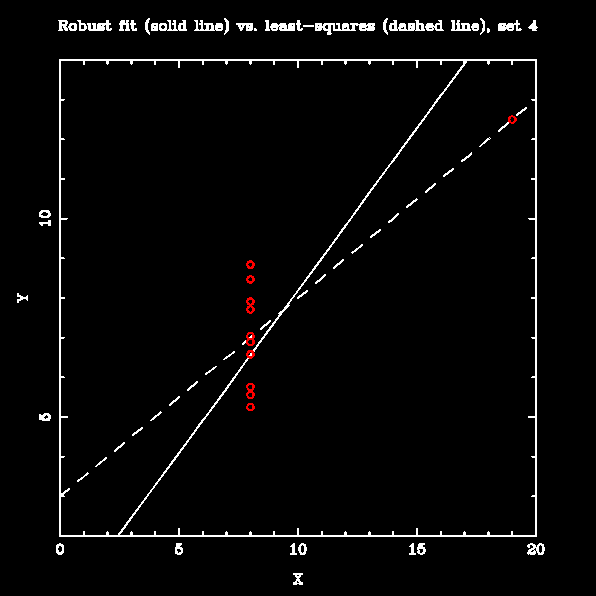
The robust fitting makes little difference when the data are linear, with few large outliers (set 1). It is markedly better than the least-squares line when the data are mostly linear with moderate slope and one outlier (set 3). For sets that are not well-represented by a straight line (sets 2 and 4), it is arguably no worse than least-squares fitting; however, prior examination of these datasets would show that fitting a straight line was not appropriate in any case.
Acknowledgments:
This quartet is used as an example of the importance of looking at your data before analyzing it in Edward Tufte's excellent book, The Visual Display of Quantitative Information. I borrowed the HTML tables of the datasets and fit parameters, and the small GIF showing the data, from J. Randall Flanagan's pages for his Statistics in Psychology course at Queen's University, Kingston, Ontario.