CEN1B: Chandra grating spectrum
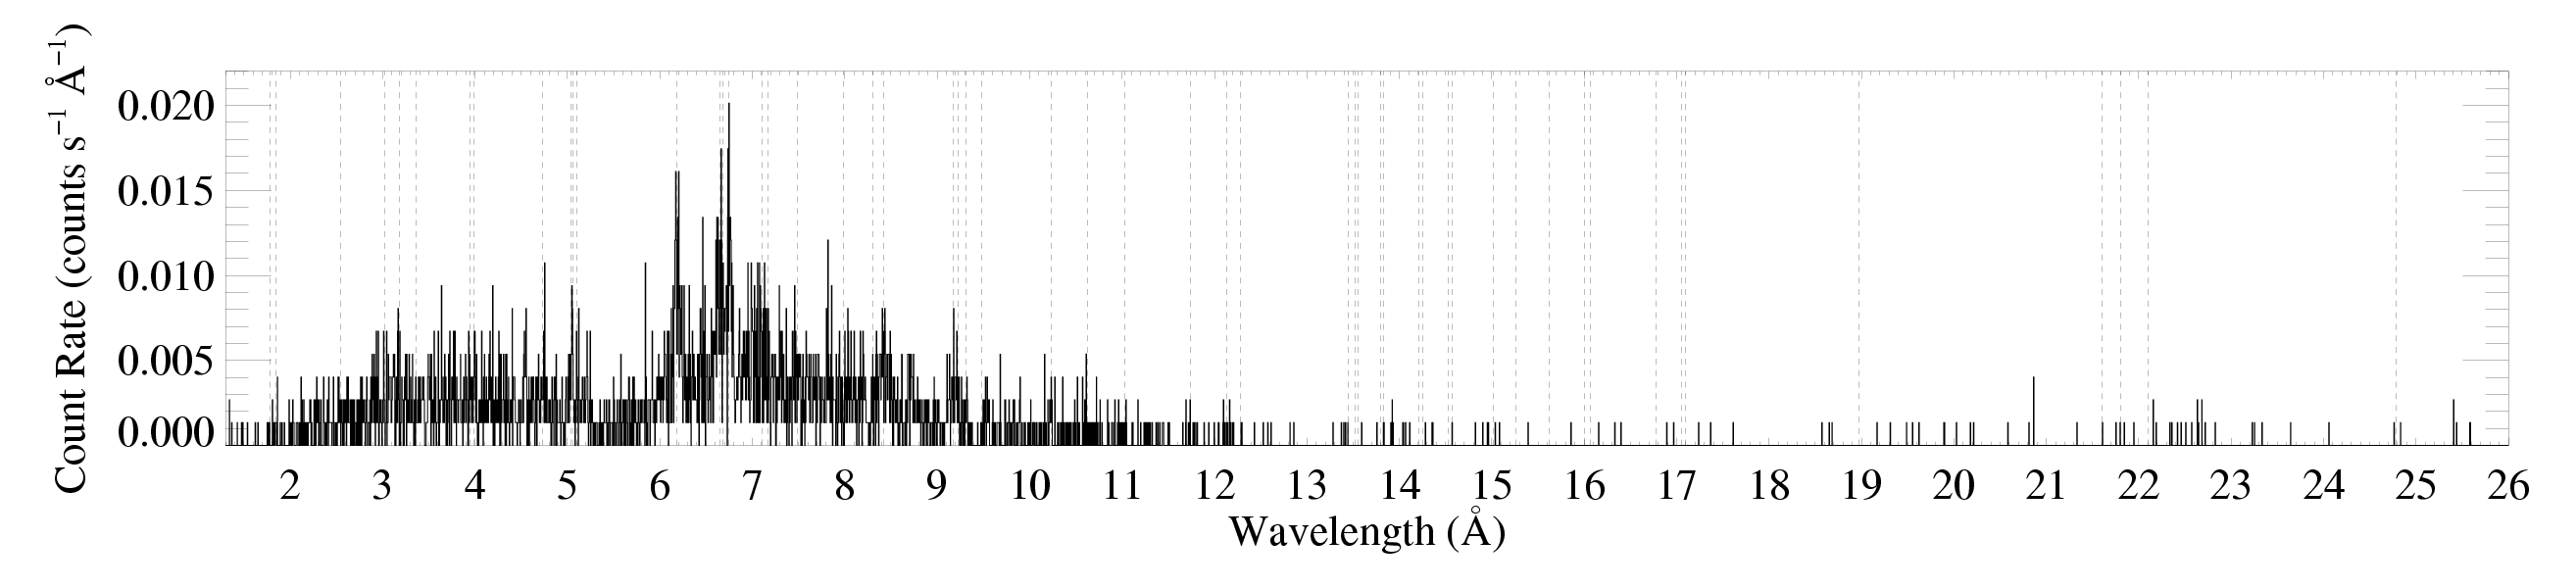
The data shown here are from James MacArthur's first extraction (9 July 2009), using Pat Broos's software, and carefully separating the dispersed spectra of the two components (A + B), using narrower than usual extraction apertures. The exposure time in 149.0 ks.
The Chandra observing proposal has some background information.
Component B - whose data are shown here - is the somewhat brighter source to the NE. This is a quick and dirty presentation and analysis of the data, showing the entire MEG and HEG (first order, coadded -1 and +1) spectra, and Gaussian fits to one line and one line complex. There are 3525 MEG counts and 1899 HEG counts in the first order spectra.
Component A is shown here.
The HETGS spectra
MEG
HEG
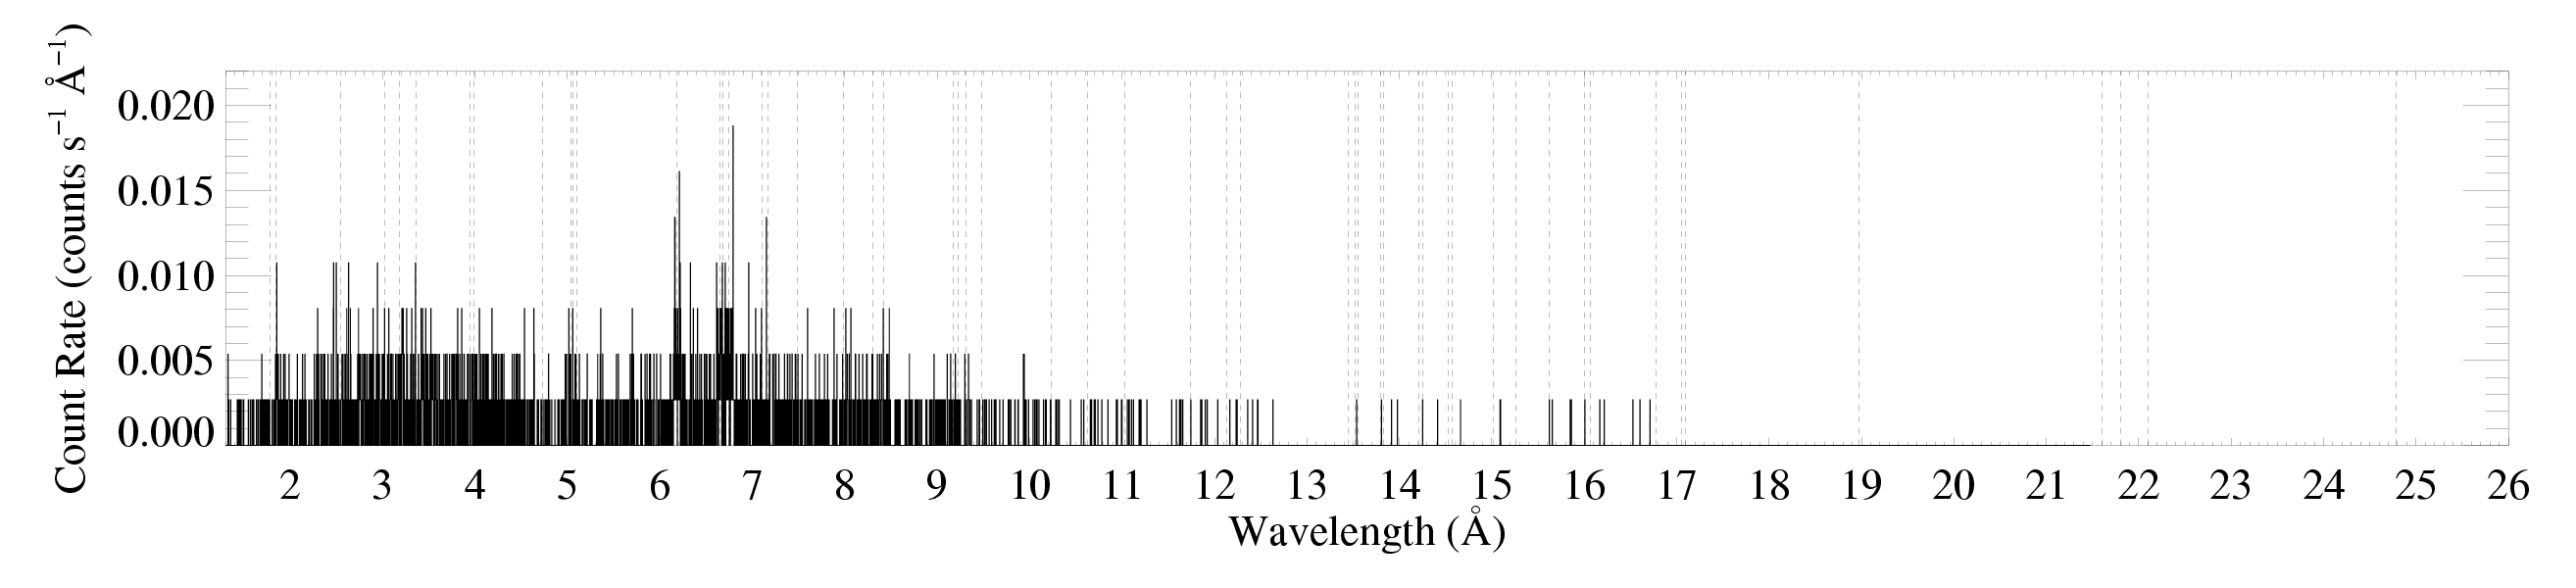
Note that the light, vertical lines are the wavelengths of emission lines seen in the Chandra spectrum of DoAr 21.
I fit a one temperature bapec*wabs model to these data. The fit was not good. The best-fit parameters of interest were kT = 10.9 keV; sigma = 859 km/s; N_H = 0.43 X 10²² (seems lower than it should be).
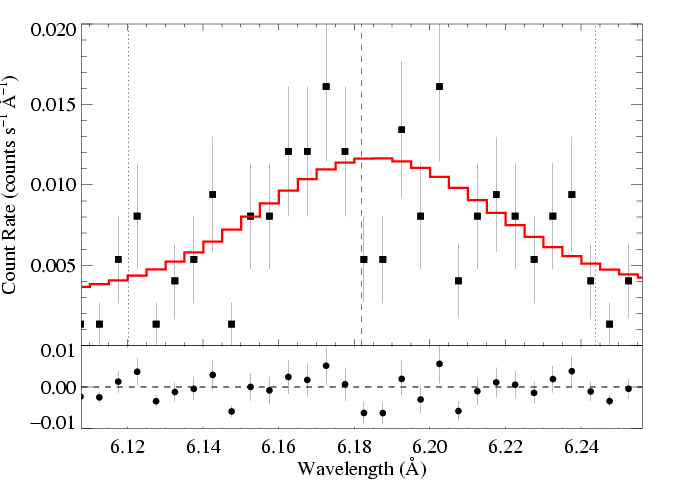
6.182 Angstroms: Si XIV Ly-alpha
These data were fit with a wgauss + powerlaw model. The MEG and HEG data were fit simultaneously. The dashed vertical line is the rest wavelength of the line, and the two dotted vertical lines represent Doppler shifts of +/- 3000 km/s (arbitrarily; we don't know the wind properties of this star or stars).
MEG
HEG
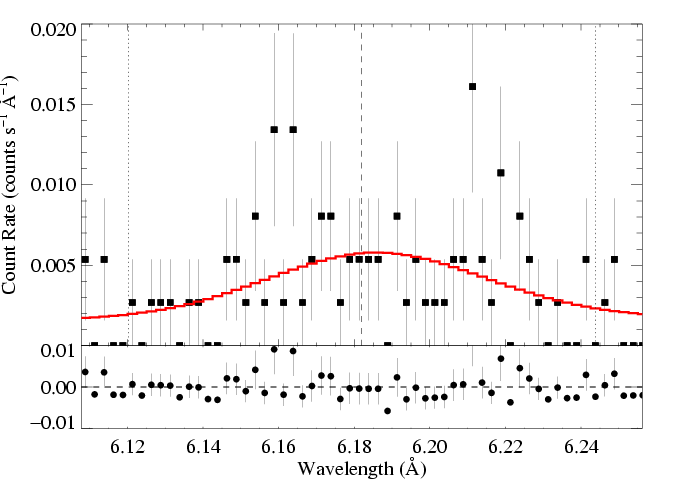
This fit is acceptable. It has a best-fit σ = 1420 km/s. Very broad. I fit the nearby continuum first.
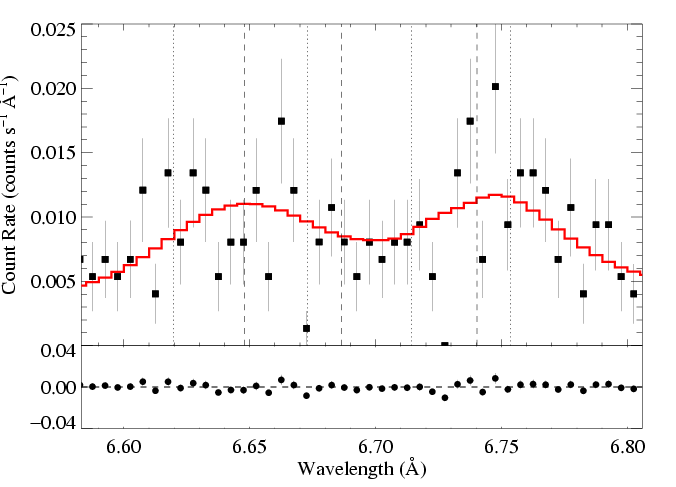
6.7 Angstroms: Si XIII helium-like res., int., for.
These data were fit with a hegauss + powerlaw model. The MEG and HEG data were fit simultaneously.
MEG
HEG
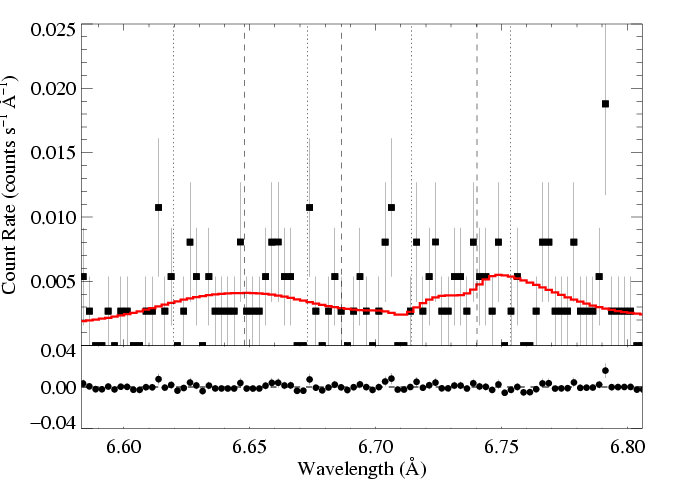
This fit is statistically good. It has a best-fit R = f/i = 20 (upper boundary for the program - so basically the upper limit is unconstrained - the intercombination line strength is consistent with zero - probably a problem with blending and modeling the continuum; the lower 68% confidence limit is R = 5 and the 95% limit is R = 2). G = (f+i)/r = 0.97, and the line width σ = 1275 km/s.
last modified: 10 July 2009