Emission lines
Analysis of the entire 94 ks observation
Note that "+/-" uncertainties are actually 68% confidence ranges for the specified parameters.
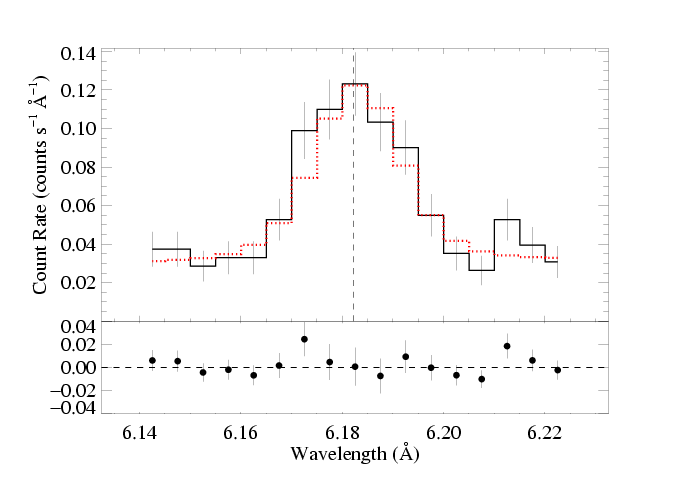
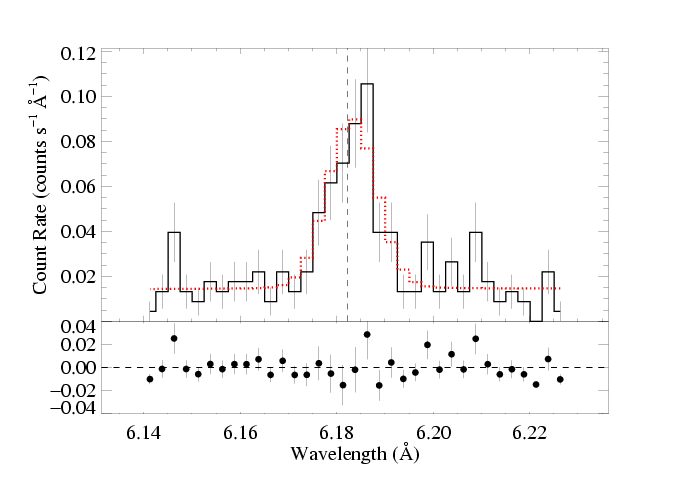
Si XIV Lyα
We use an emissivity-weighted mean wavelength of 6.1822 A for the Lyman-alpha doublet of H-like silicon. We fit the MEG (top) and HEG (bottom) with wgauss + pow:
|
[6.14:6.23] note: we could refit on a smaller wavelength range
powerlaw continuum, n=2; norm=3.59e-3 σλ=2.77 +/- (unc.:3.71) mA δλ=0.926 +/- (0.274:1.55) mA λo=6.1822 A norm=1.94e-5 +/- (1.80e-5:2.09e-5) χ2 = 92.18 (N=104) |
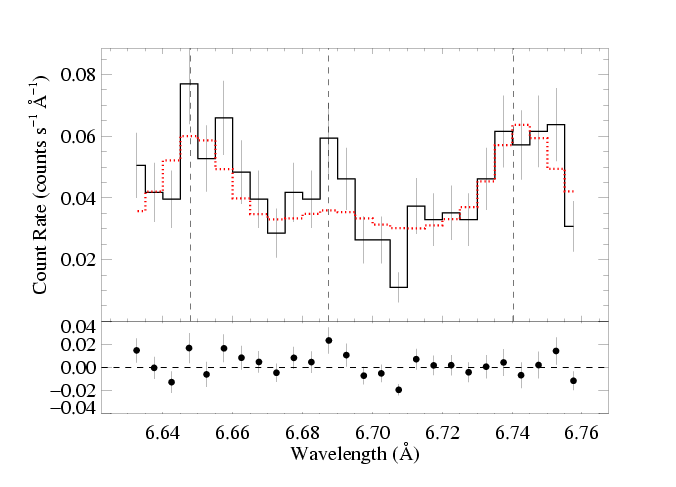
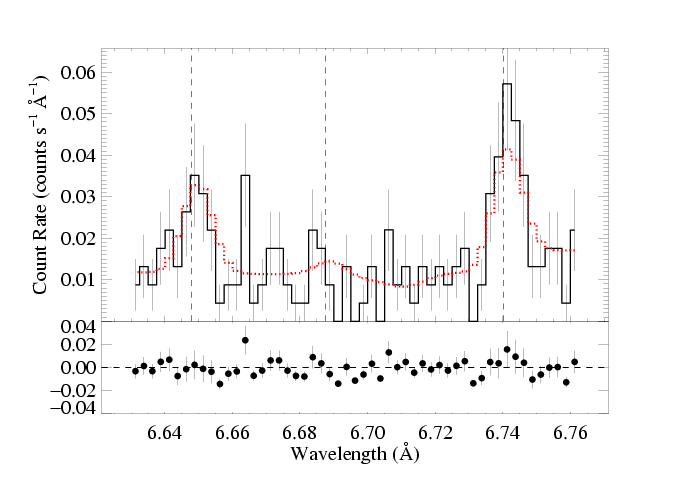
Si XIII Heα
He-like complexes - resonance, intercombination, forbidden lines - in the MEG (top) and HEG (bottom) panels, fit with hegauss + pow:
|
[6.63:6.765]
powerlaw continuum, n=2; norm=3.22e-3 R=5.45 +/- (3.20:unc.); 2.10 95% lower conf. lim. G=1.21 +/- (0.96:1.56) σv=68 +/- (unc.:100) km/s δv=76 +/- (46:92) km/s norm=1.29e-5 +/- (1.14e-5:1.47e-5) χ2 = 140.29 (N=158) |
S XVI Lyα
We use an emissivity-weighted mean wavelength of 4.731 A for the Lyman-alpha doublet of H-like sulfur. We fit the MEG (top) and HEG (bottom) with wgauss + pow:
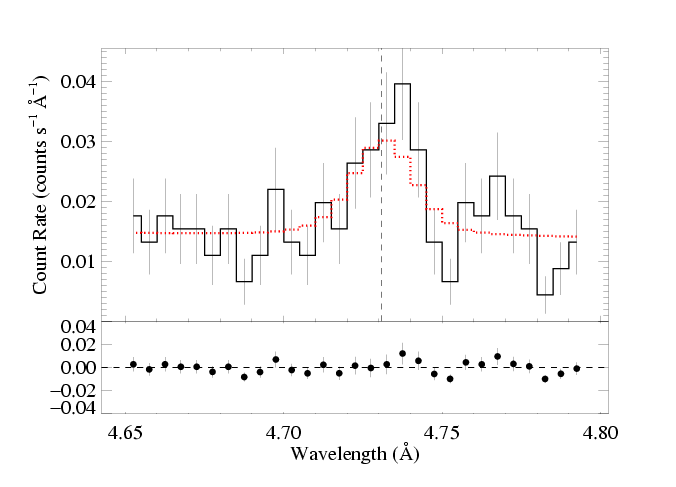

|
[4.65:4.80] note: we could refit on a smaller wavelength range
powerlaw continuum, n=2; norm=4.54e-3 σλ=5.07 +/- (3.26:8.06) mA δλ=0.585 +/- (-1.96:2.66) mA λo=4.731 A norm=1.04e-5 +/- (0.85e-5:1.26e-5) χ2 = 142.02 (N=176) |
S XV Heα
He-like complexes - resonance, intercombination, forbidden lines - in the MEG (top) and HEG (bottom) panels, fit with hegauss + pow:
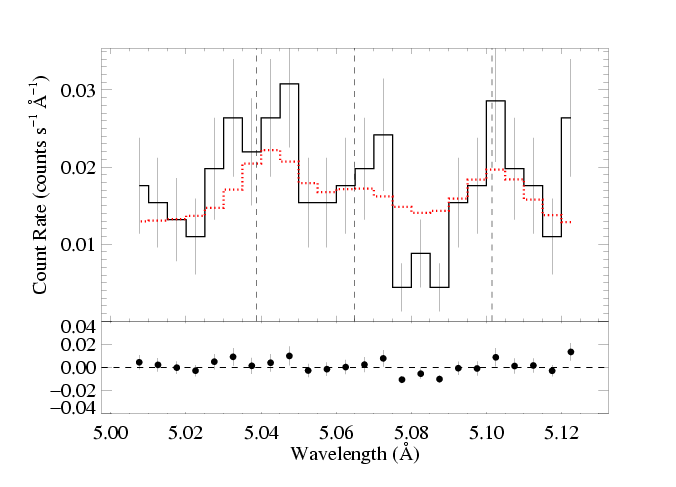
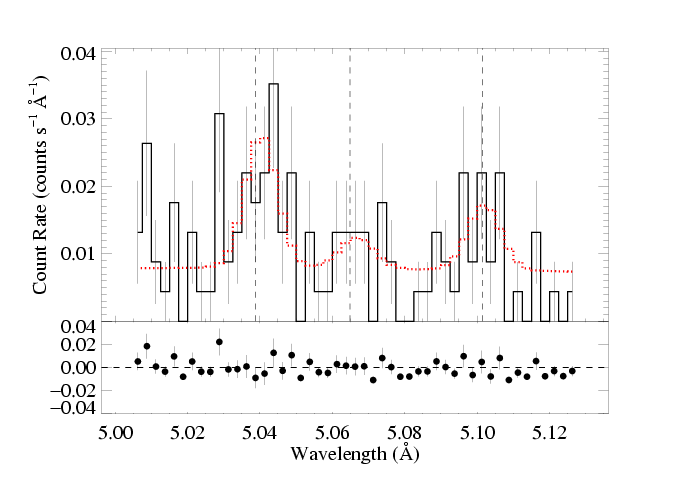
|
[5.005:5.13]
powerlaw continuum, n=2; norm=4.21e-3 R=1.90 +/- (1.08:4.18); 0.62 95% lower conf. lim. G=0.72 +/- (0.49:1.06) σv=113 +/- (69:133) km/s δv=73 +/- (46:131) km/s norm=1.90e-5 +/- (1.55e-5:2.28e-5) χ2 = 147.78 (N=146) |
Summary of line ratios
Si XIV/XIII = 1.50+.33-.28
Si XIII R = f/i = 5.40-2.2 while Ro=2.3
S XVI/XV = 0.55+.26-.18
S XV R = f/i = 1.90+2.28-.82 while Ro=2.0
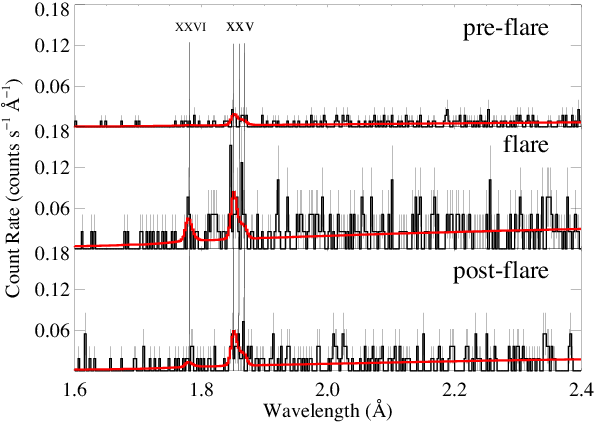
These ratios can be compared to models (temperature for Lyα/Heα and density for R = f/i). And we could also divide up the data into pre-flare, flare, and post-flare intervals and look for statistically significant changes in the line ratios. Thus far, we have only done this for the Fe K-shell lines seen in the HEG spectrum:
Line ratio modeling: R values for the He-like features
Both the Si XIII and the S XV R=f/i are consistent with the low-density limit. Because the Si XIII f/i ratio has the lower critical density, this feature provides the stronger constraint of the two.

Si XIII: 95% lower confidence bound on f/i is shown as a dash-dotted line, corresponding to a range of densities (4 to 9 X 1012 cm-3), depending on the choice of model (solid is Blumenthal, Drake, & Tucker 1972; dotted is Porquet & Dubau 2001; and dashed is PrismSpect (MacFarlane et al., 2004)).
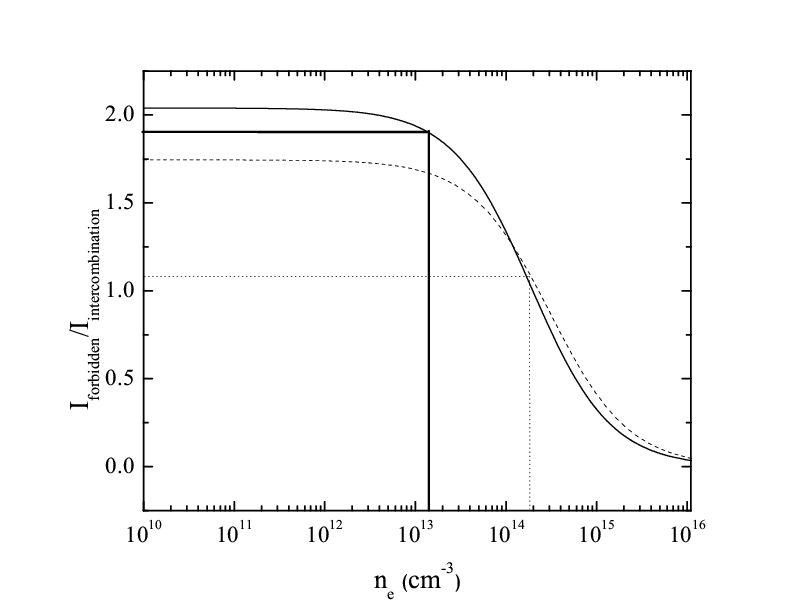
S XV: best-fit f/i is shown as the solid horizontal line. The 68% lower confidence bound is shown as the dotted line.
Back to the main page.
last modified: 3 May 2009