PrismSpect simulations of the SSX soft x-ray spectrum
In support of NSF-DOE renewal proposal (M. Brown and W. Matthaeus, co-PIs): Nonlinear Magnetohydrodynamic and Kinetic Processes: Theory, SSX Experiments, and Connections to Space and Astrophysics
See the project summary and the project description. Background material and simulations used to make Figs. 9 and 10 in Sec. 4.3 are detailed here.
Models shown here: non-LTE steady-state with n=1015 cm-3, ΔL = 10 cm
0.98 H, 0.01 C, and 0.01 O, by number
version 5: 20 December 2004
The first two figures are in support of the SXR component of the proposal. We show, for a simple model, the temperature dependence of the spectral emission and, the trends expected in the four channels of the SXR.
The figure relevant to the IDS section is at the bottom of the page.
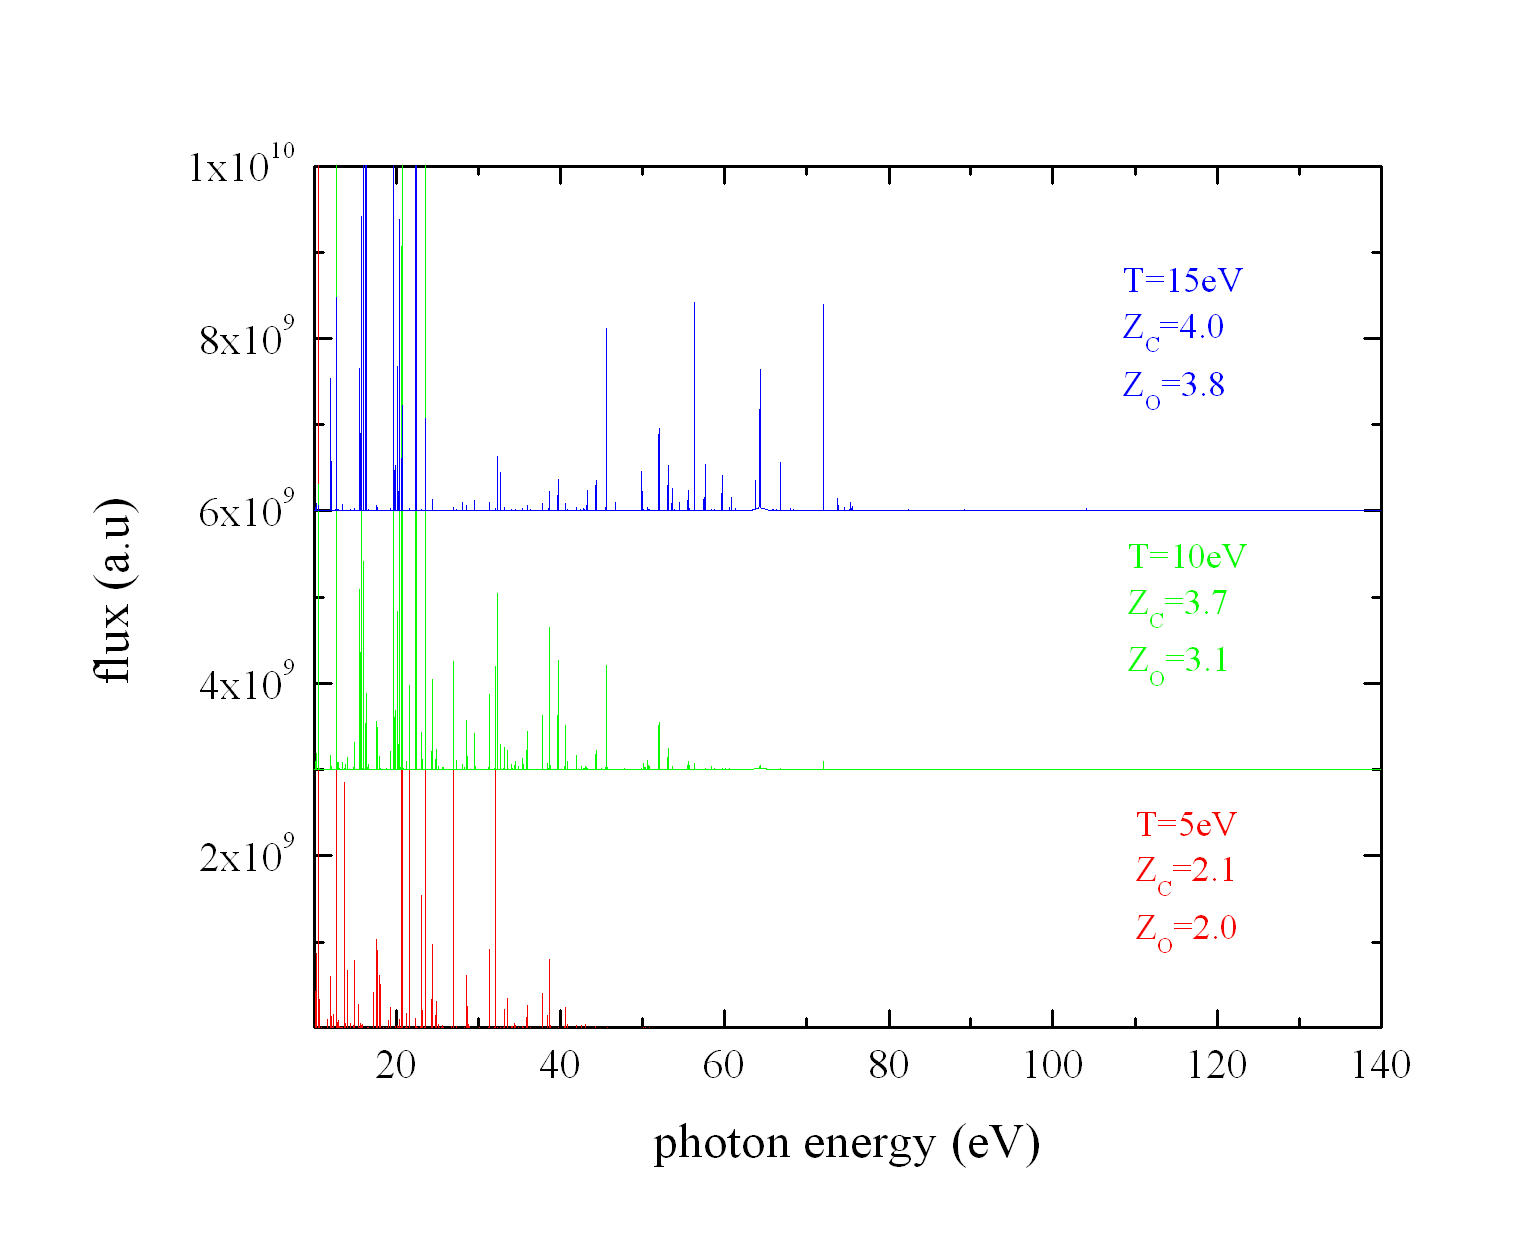
Download the full resolution image. The three spectra are offset for calrity. Note the increasing strength of numerous higher-energy emission lines as the temperature increases. This is mostly a consequence of the increasing levels of ionization, which are indicated in each panel as the mean ionization state of carbon and oxygen. There is a weak free-free and recombination continuum under the predominant line emission. We use several hundred levels of carbon and oxygen, each, in our simulations.

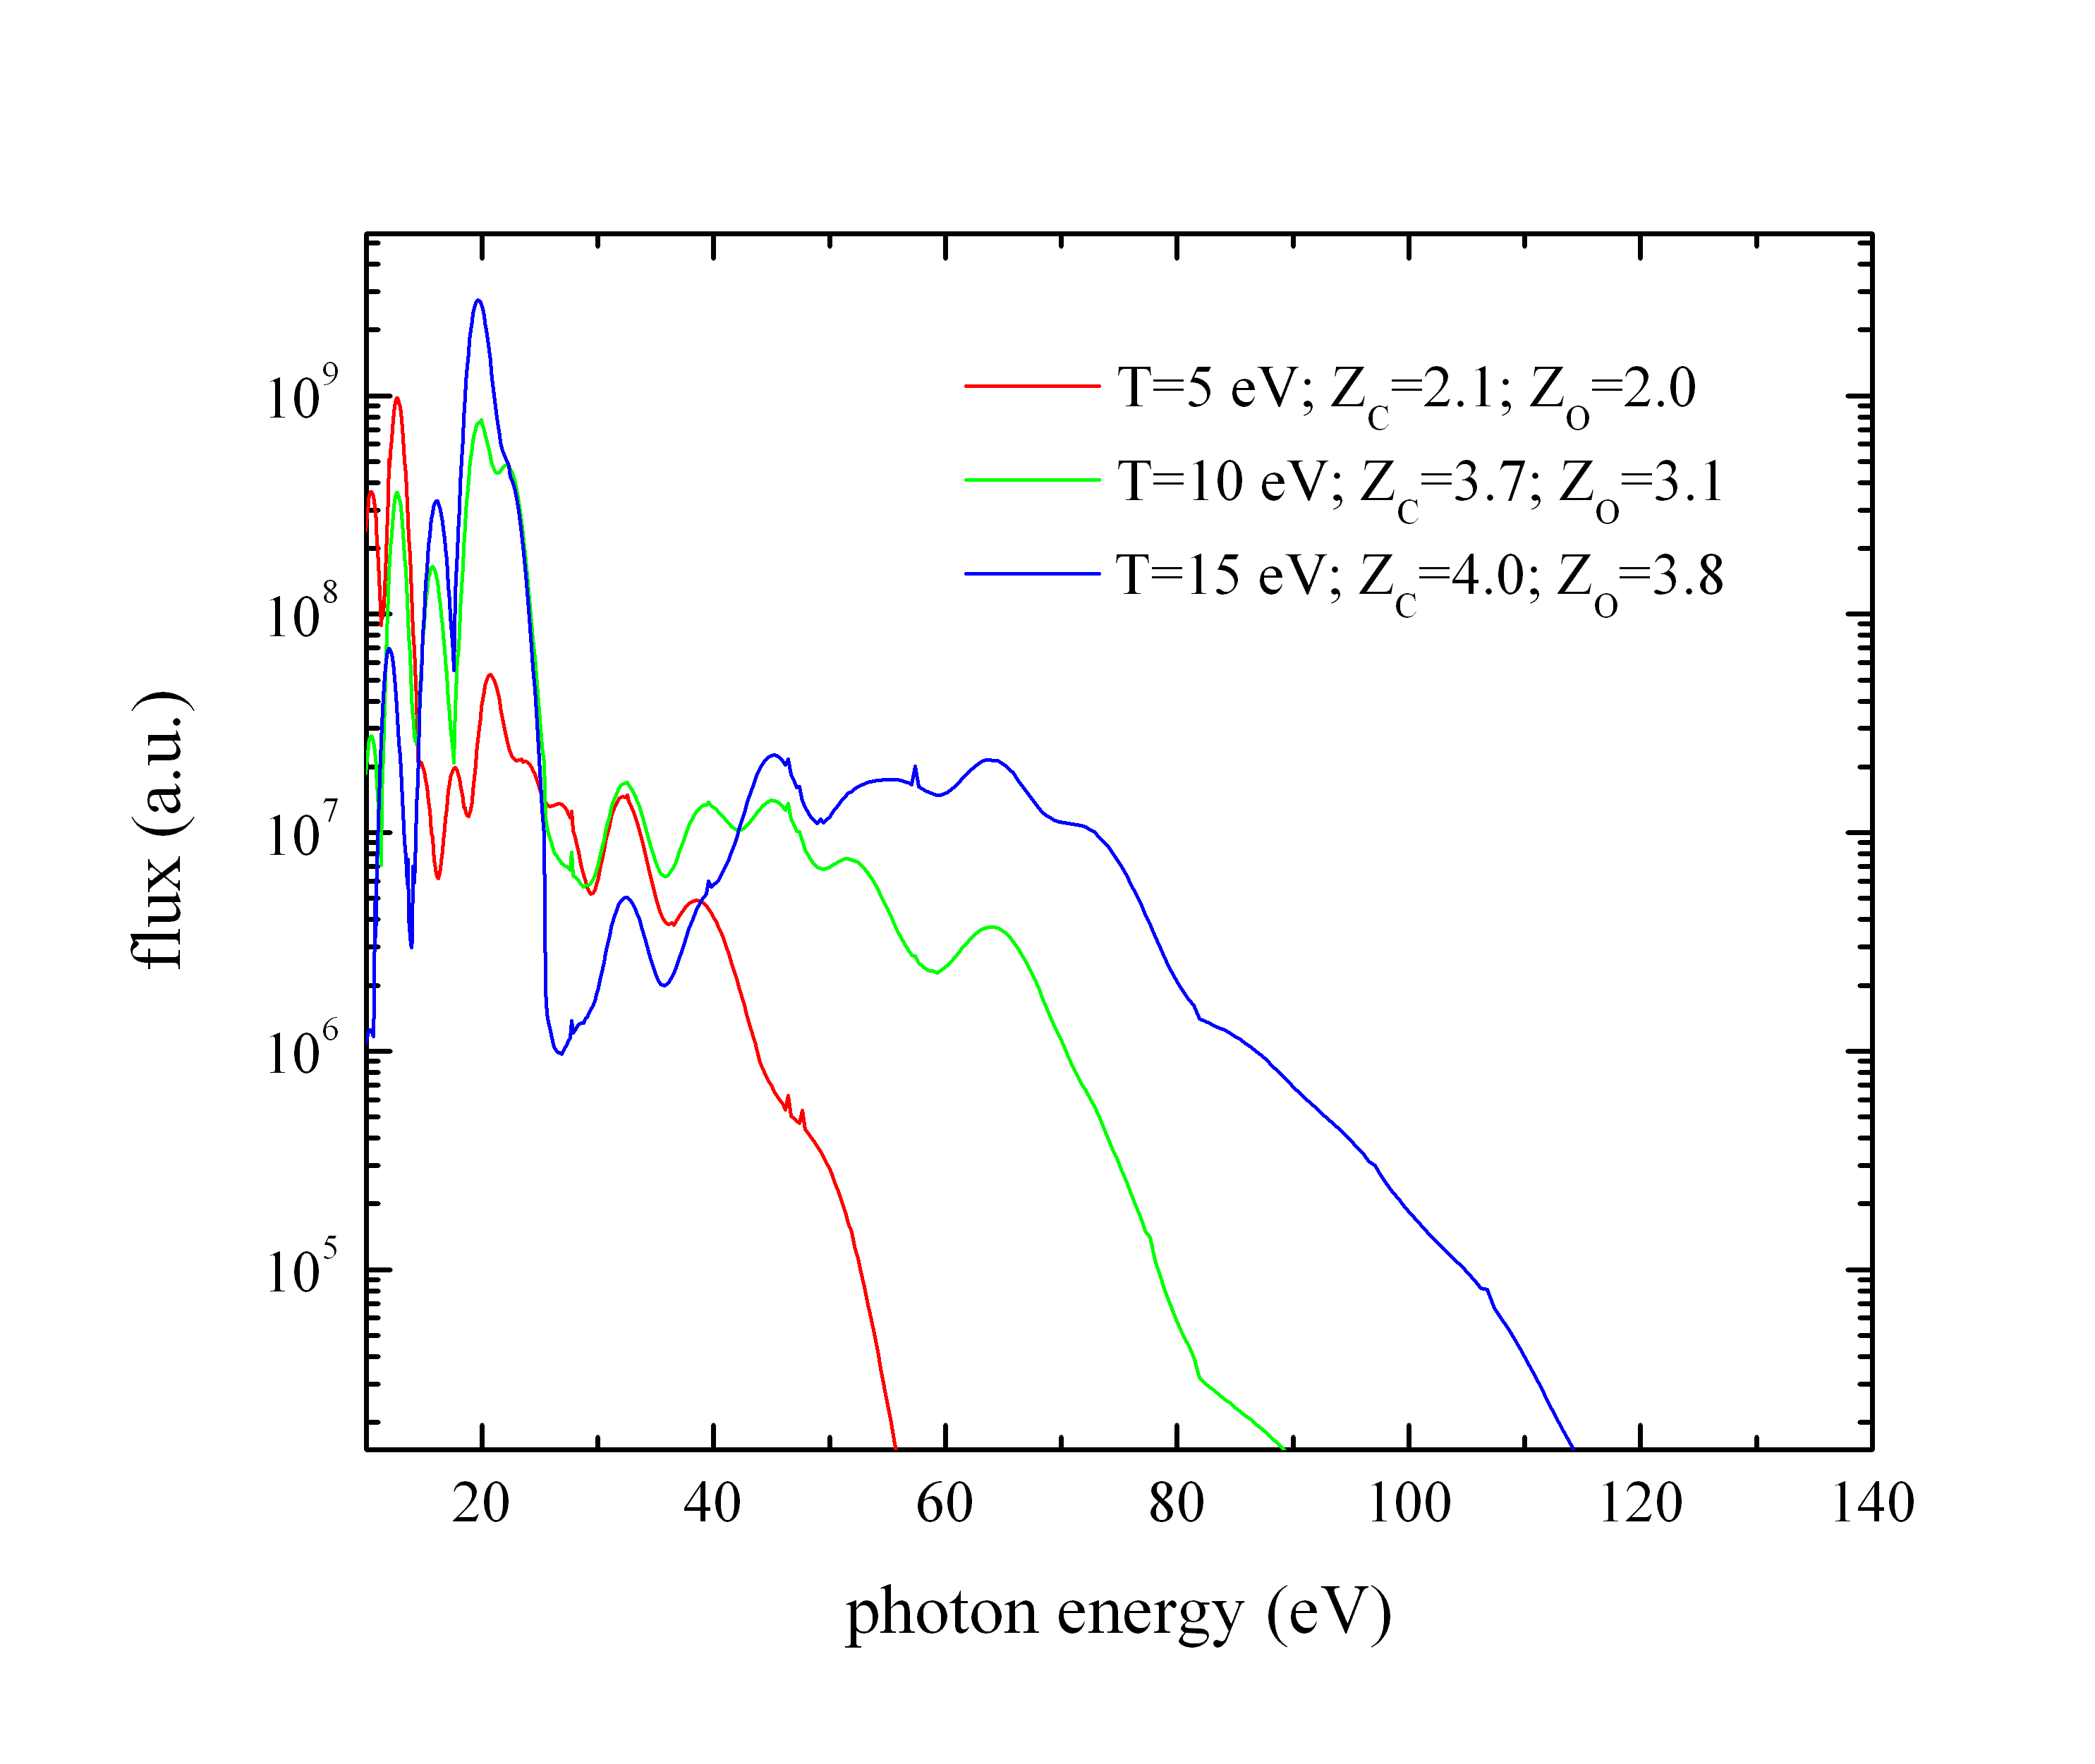
Download the full resolution image [color jpeg, color bitmap, black/white jpeg, black/white bitmap]. The same three spectra, but convolved to a very coarse resolution. This figure makes it easy to see general spectral trends, and predict what would be seen in the four SXR channels for different plasma properties. With the 2% impurity level, lines dominate the emission in the lower energy filters, but note the bremsstrahlung contribution at high energies.
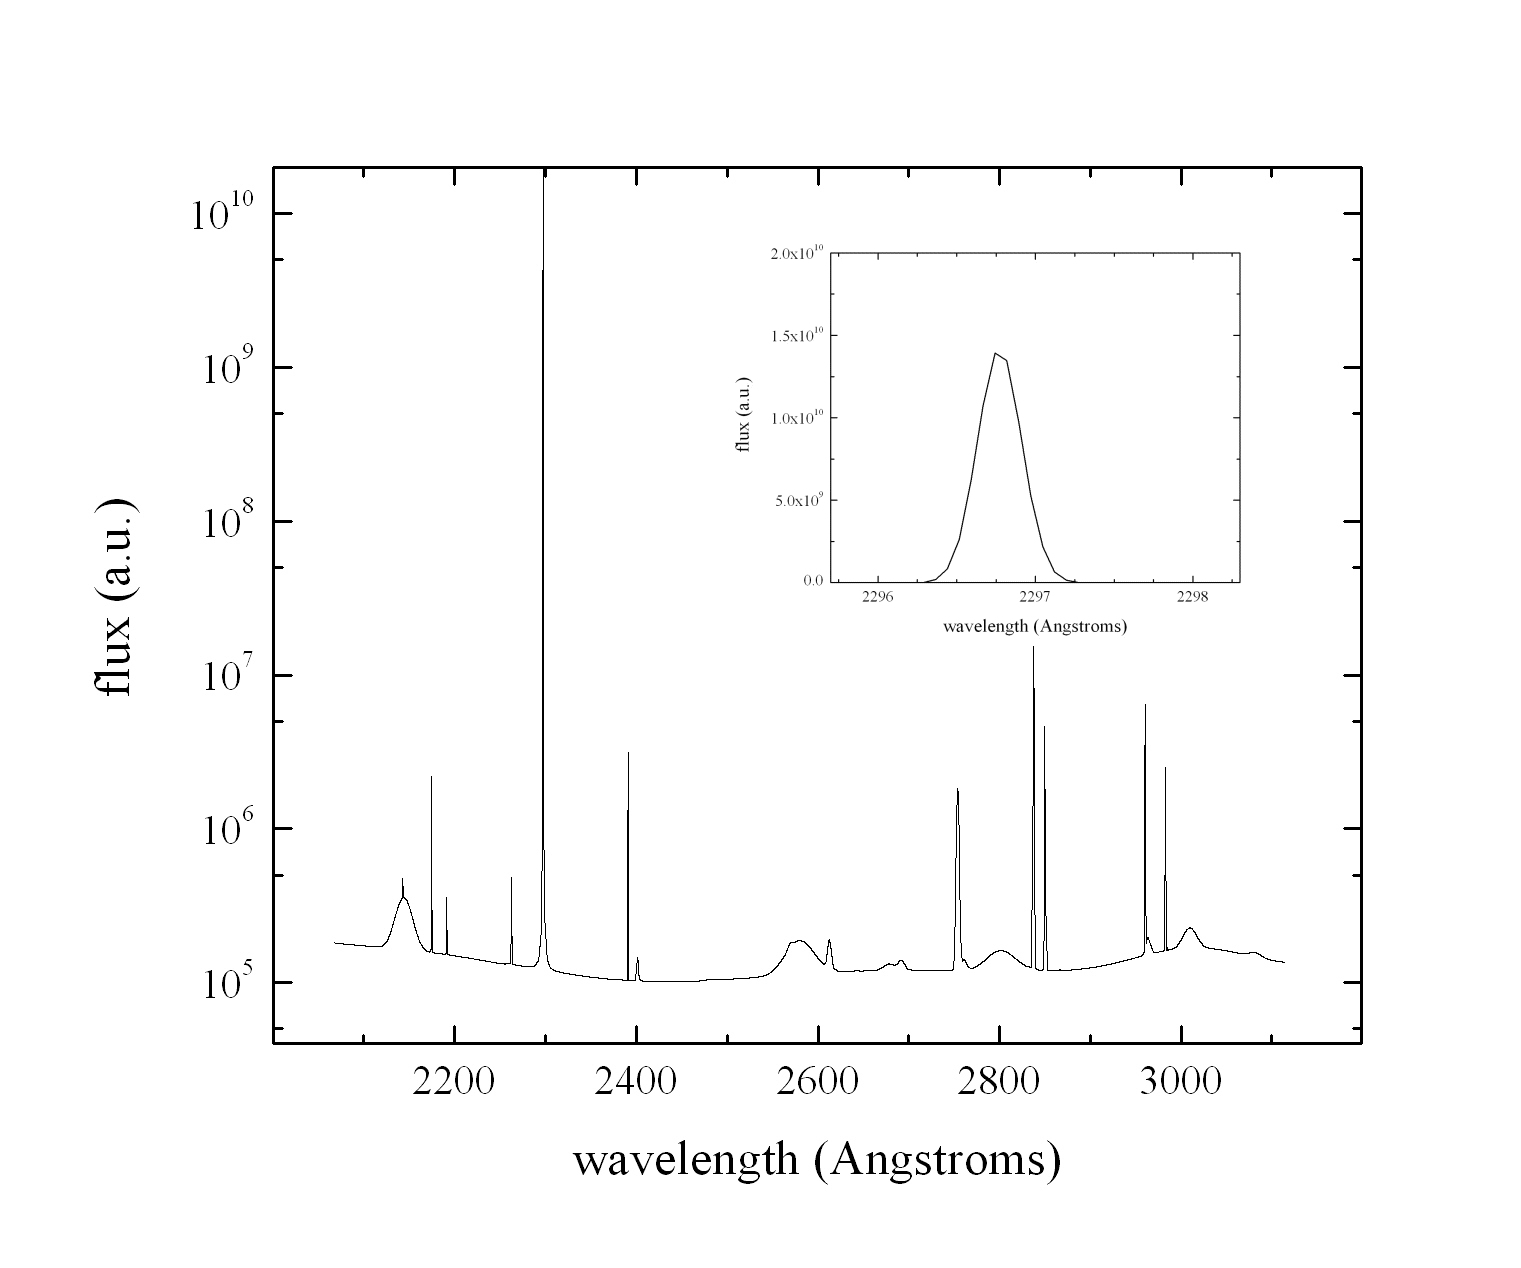
Download the full resolution image. This is the output of the T=5eV non-LTE calculation shown above, but in the ultraviolet part of the spectrum. The strongest line is the C III 2297 Angstrom line, which is also shown in the inset. In this simulation, we have included instrumental broadening and thermal broadening (but for the modest, assumed temperature of 5 eV). Instrumental broadening (R = 6400) dominates. As part of this project, we propose to incorporate a Doppler broadening capability in Spect3D that will allow us to generate spectral diagnostics of flow from the fluid code simulations. By comparing this simulation to the series of measurements below, it can be seen that some excess broadening, probably due to flow, is indicated by the data. We propose to model this effect.
data

model

Note that we have manually shifted the line from the calculated wavelength of 2297.48 Angstroms to 2296.8 Angstroms. The latter is the wavelength of the transition in air and is consistent with what is observed in the data (although the wavelength calibration is not necessarily quite as accurate as implied). The wavelength of this line in the PrismSpect model is close to, but not exactly the same as, the NIST value (2297.48 vs. 2297.578).