Revisiting the Chandra X-ray spectrum of τ Sco: global thermal modeling and helium-like f/i ratios
Background
We are revisiting the Chandra grating spectrum of the BO.2 V star τ Sco, focusing on the He-like f/i ratios (of Mg XI and Si XIII) and also looking at the global thermal properties of the X-ray emission. This reanalysis includes both Chandra pointings (only the longer one was used in Cohen et al. 2003), and fixes the shortcomings of the atomic physics model used in that paper to analyze the He-like line ratios (same problem discussed with respect to θ1 Ori C here).
The context of this reanalysis is that the lack of rotational modulation of the X-rays (Ignace et al. 2010) shows that the X-ray emitting plasma cannot be in the closed field regions shown in the model of the magnetosphere in Fig. 11 of Donati et al. (2006). We are also carrying out new potential field extrapolations of the magnetosphere of τ Sco to see if there is a way to reconcile the X-ray spectral data with an origin of the X-ray emission in the closed-field regions of the star's magnetosphere.
The Chandra grating data presented here comprises both Obs. IDs 638 and 2305, for a total effective exposure time of 72,130 seconds.
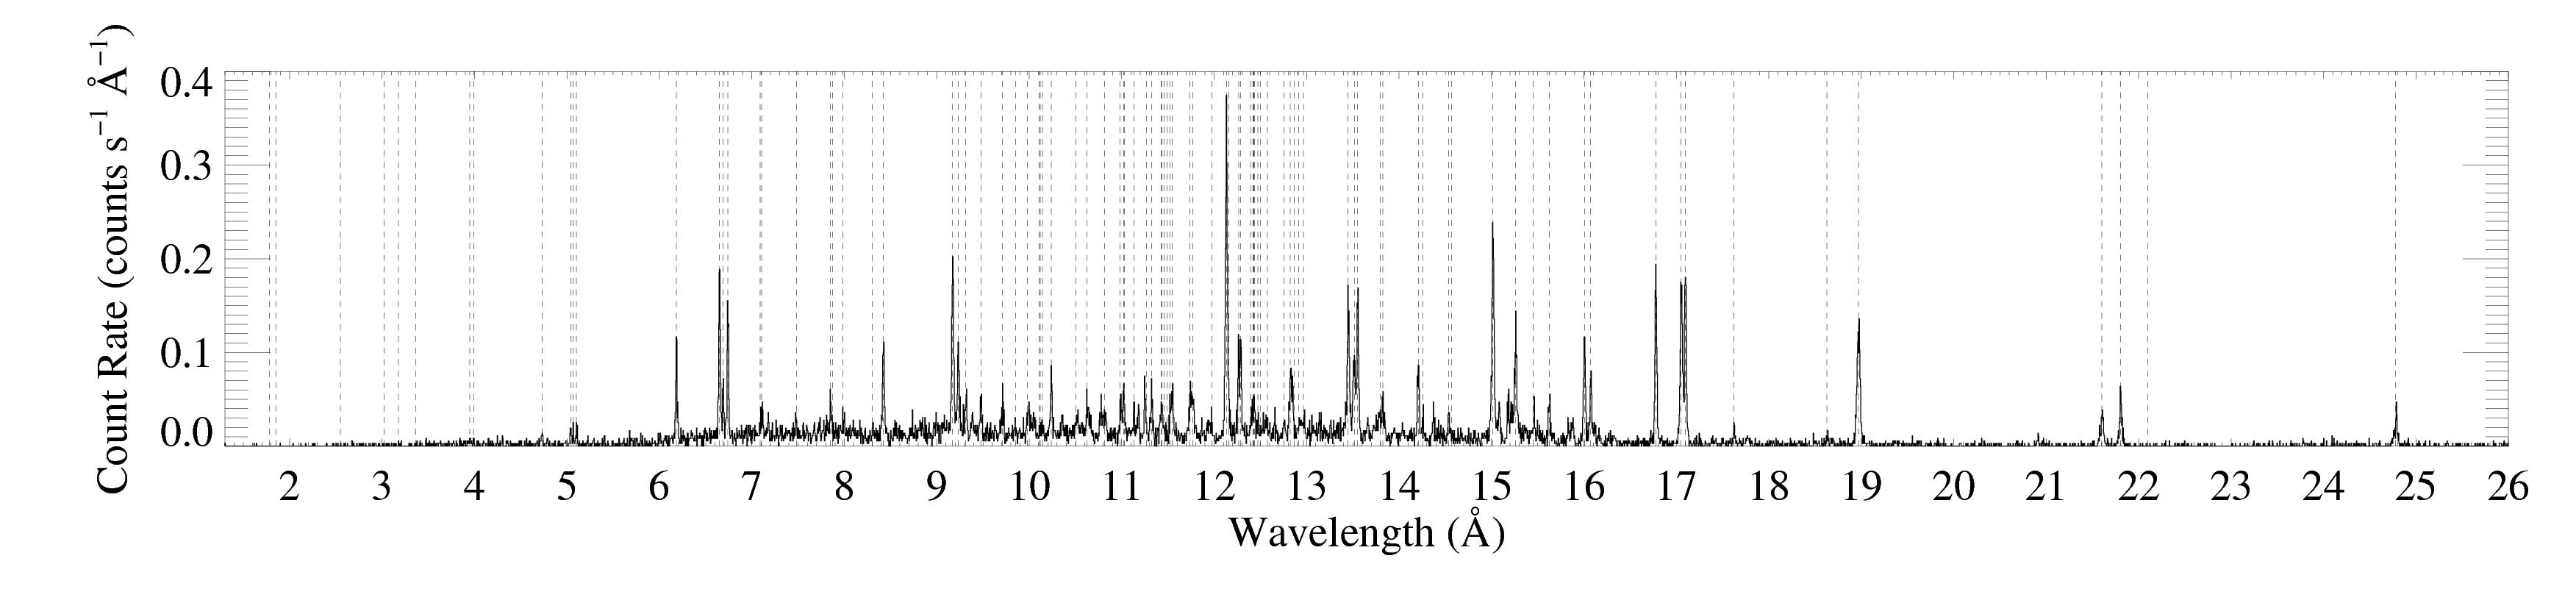
Entire HETGS spectrum
MEG
HEG
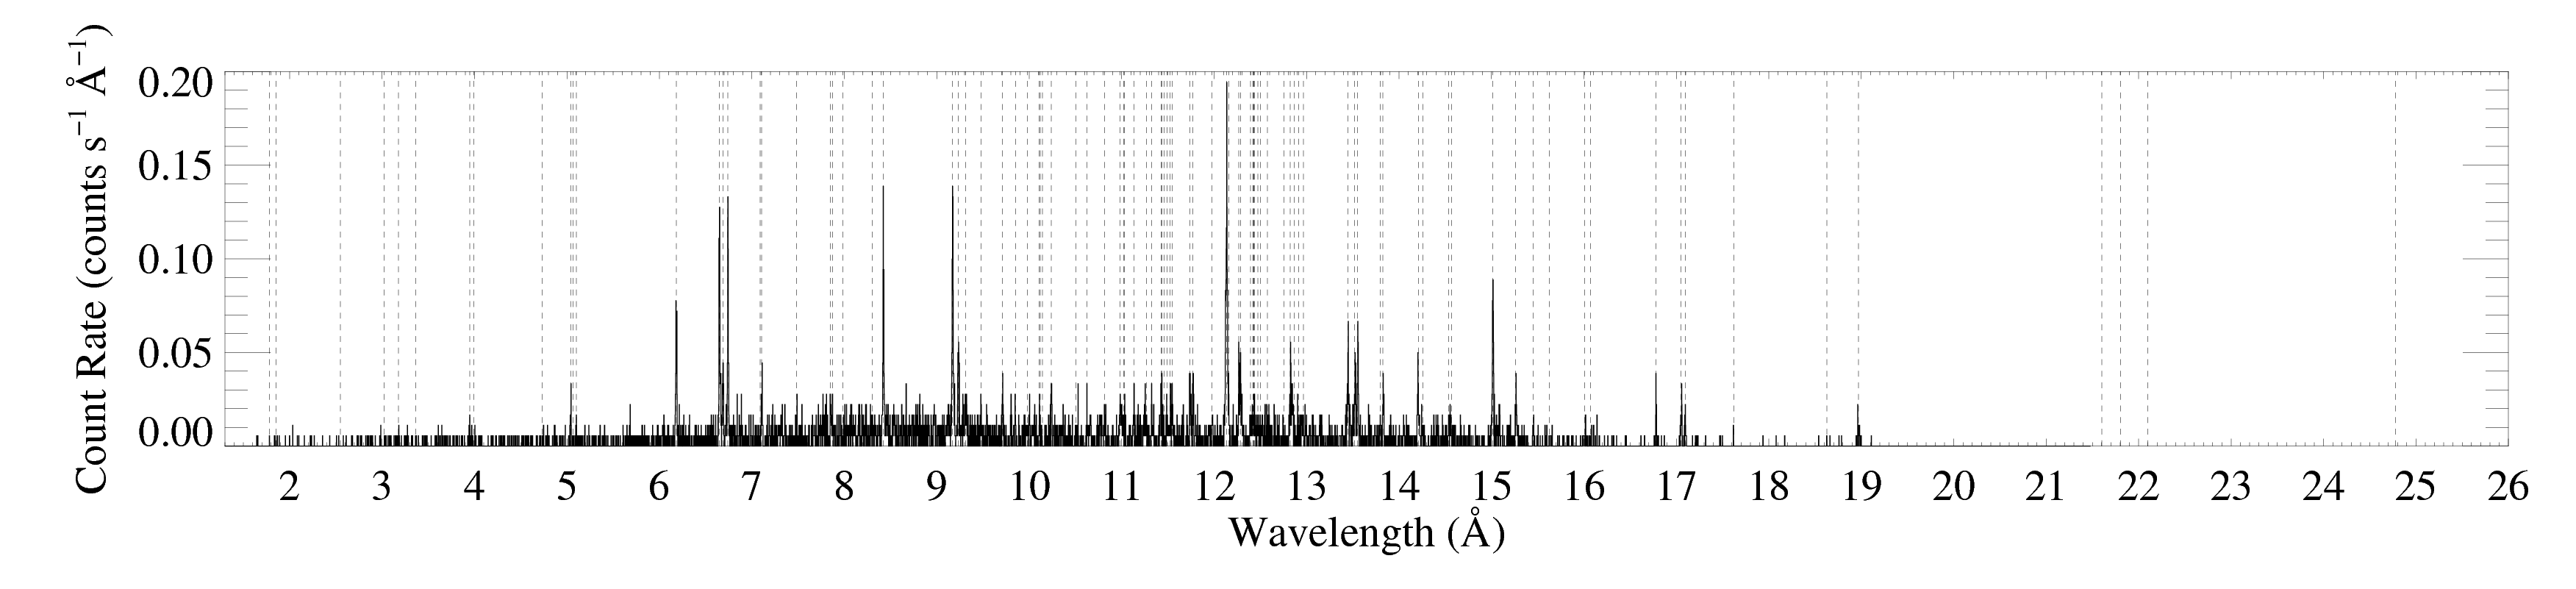
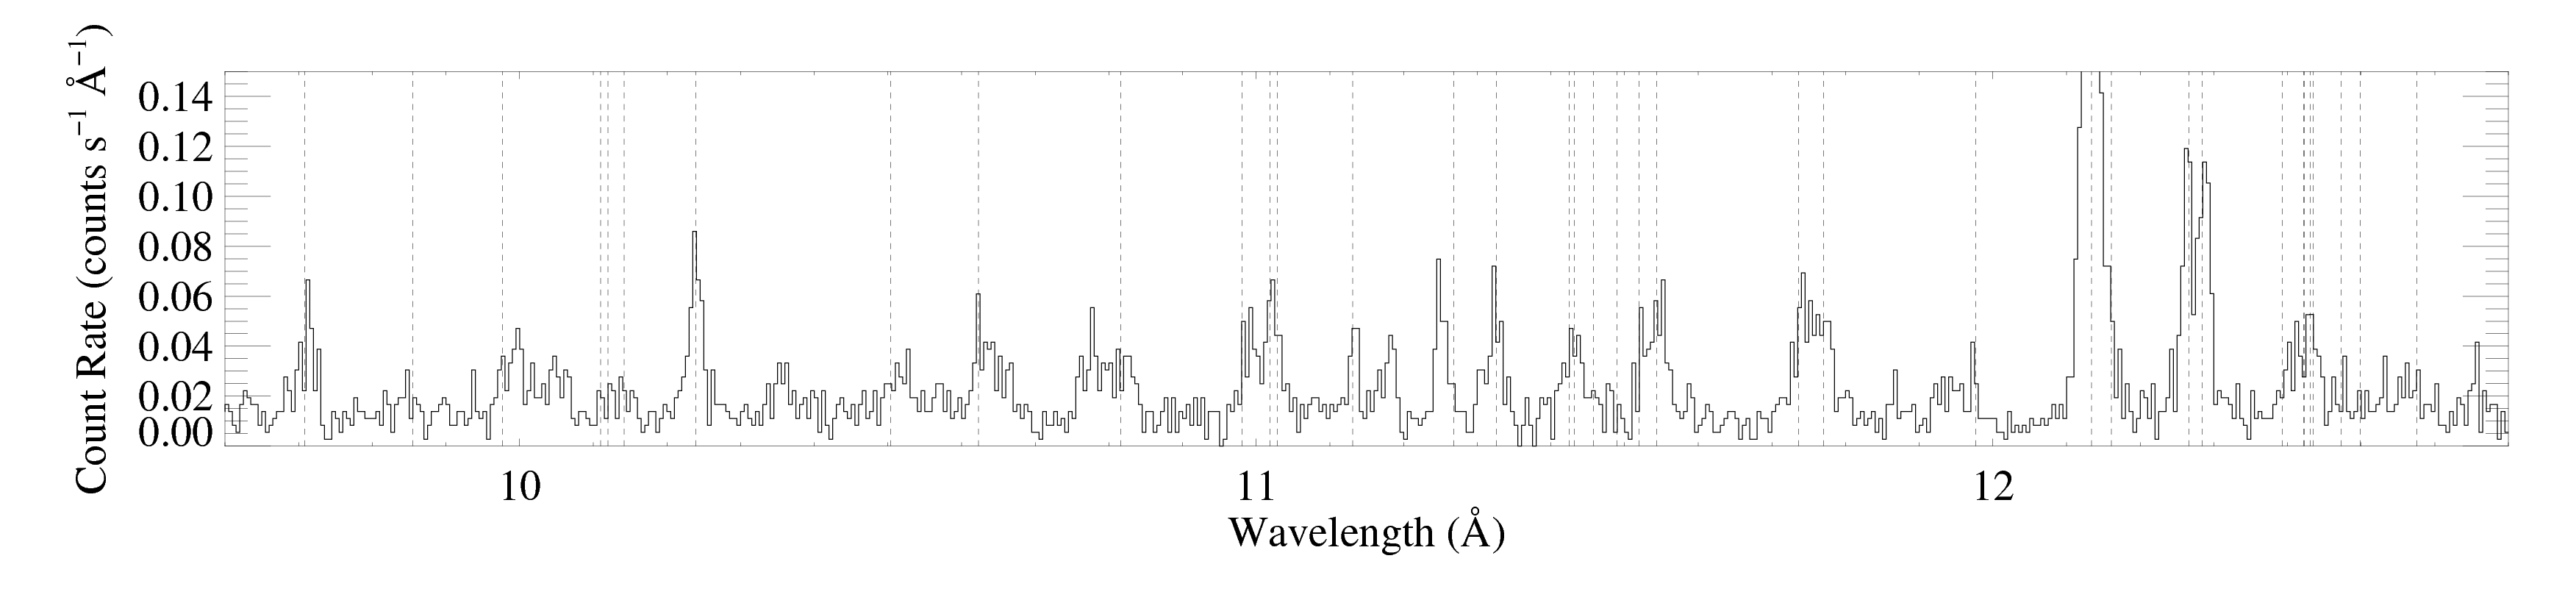
Note that the y-axis range is only half as big for the HEG plot. And that the vertical dotted lines indicate the wavelengths of emission lines from an exhaustive line list (Table 1 of Cohen et al. 2003, plus a few dozen additional lines, mostly from iron L-shell transitions). A zoom in on the 9.6 to 12.7 Angstrom region shows that some of these lines are present in the data, but not all of them.
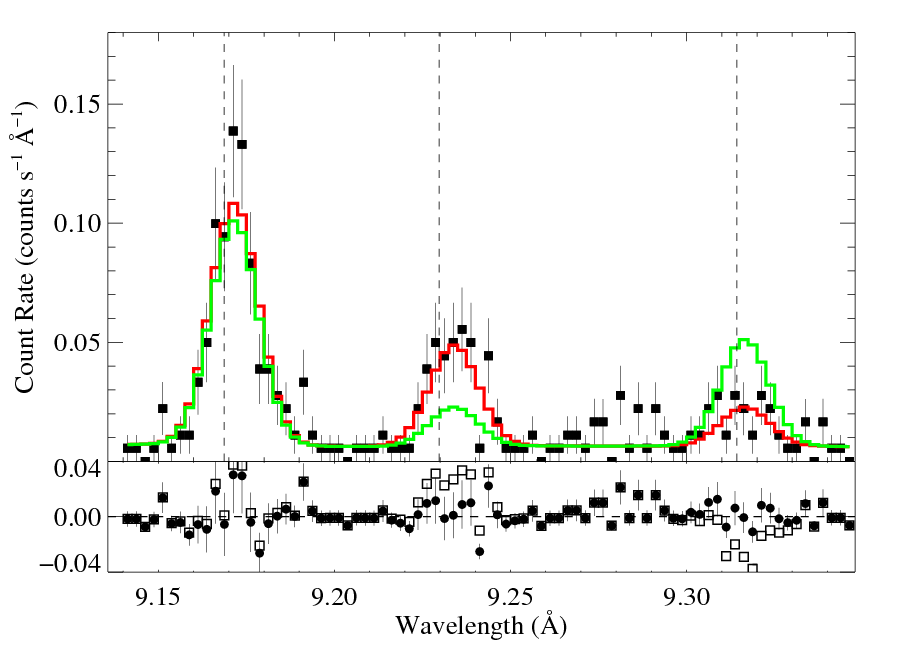
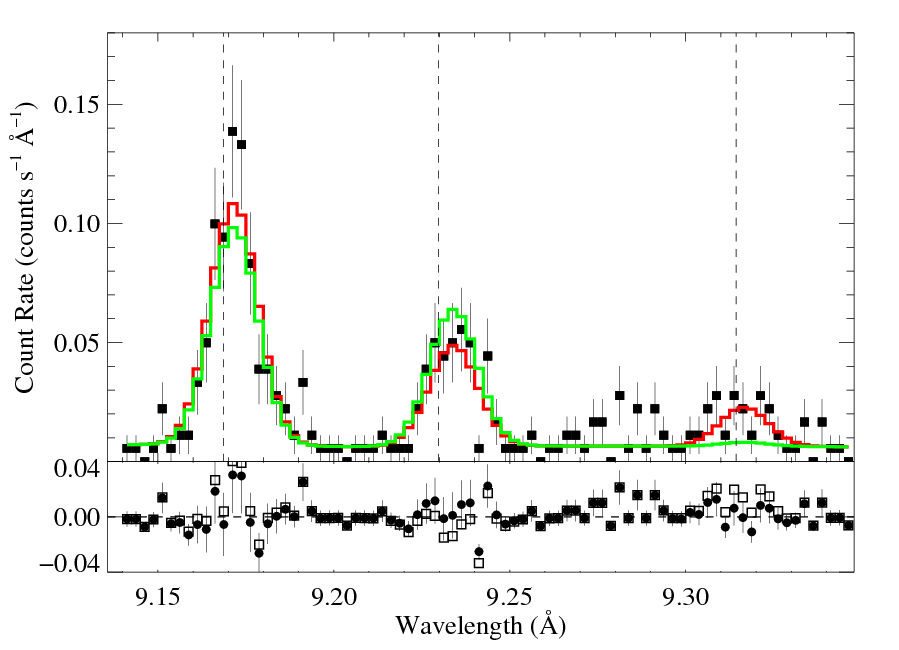
He-like complexes
We fit these complexes with the model hegauss + pow, where the power-law model accounts for the weak continuum, and the hegauss custom model consists of three Gaussian line profiles, with their widths and centroid shifts linked (i.e. all three individual profiles have the same width and shift), and with the free parameters controlling the line strengths being R = f/i, G = (f+i)/r, and the overall normalization. Note that this parameterization enables us to implicitly assess the correlation between the strengths of the f and i lines when determining the formal uncertainty on R.
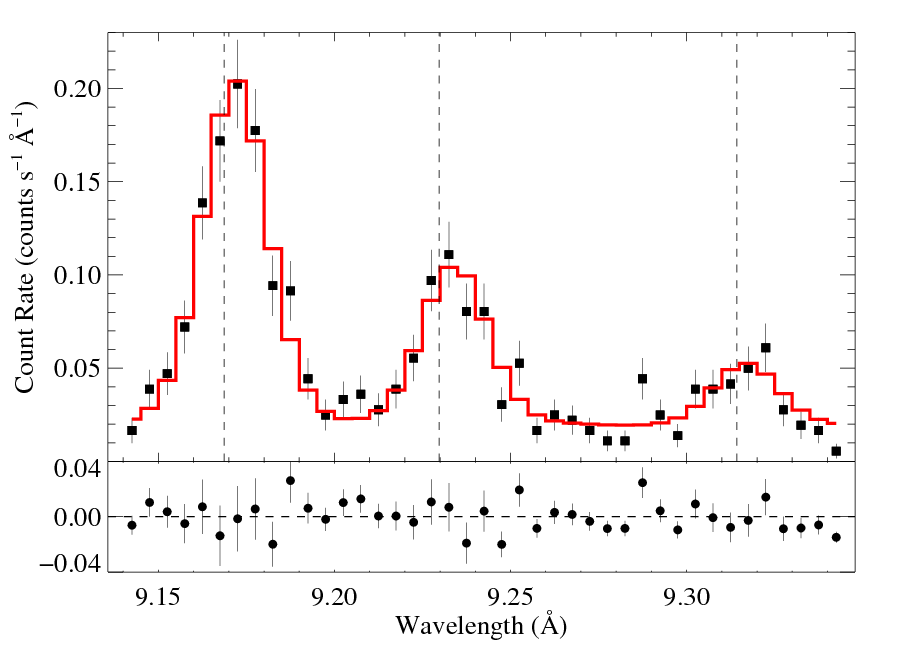
Mg XI He-alpha: 9.17, 9.23, 9.31 Angstroms
MEG
HEG 
|
[8.14:8.35] R = 0.38 +/- (0.32:0.45; 0.29:0.50 is the 90% confidence range) G = 0.63 +/- (0.58:0.69) v_turb = 184 km/s +/- (166:203) v_shift = 98 km/s +/- (85:112) powerlaw continuum, n=2; norm=2.51e-3 norm=8.44e-5 +/- (8.19e-5:8.97e-5) rejection probability = ?? (C=274.20; N=248) |
The relatively large wavelength shift (the v_shift parameters, and also seen in the figures; compare the vertical dotted lines indicating the lab rest wavelengths to the emission line centroids) are statistically significant, but may not mean anything. There is a fair amount of scatter in the line centroids from the detailed fitting of all the lines in the Chandra spectrum, as described in Sec. 5.4 and Fig. 10 of Cohen et al. (2003).
To interpret this measured R = f/i ratio, we used a solar abundance TLUSTY model atmosphere to estimate the photospheric surface flux at the wavelengths of the relevant transitions (997.5 and 1034.3 Angstroms). Donati et al. (2006) state the effective temperature and log g of τ Sco as 31,000 and 4.25. We looked at two different TLUSTY models, both with log g = 4.25, but one with Teff = 30,000 and one with Teff = 32,500. We averaged the model atmosphere flux over a small wavelength range around the two transitions, corresponding to a Doppler width of about 500 km/s. We found little difference in the fluxes between the two different model atmospheres (Hν = 1.7e-3 and 1.9e-3, respectively). The difference between these two values is commensurate with the differences between the fluxes at the two different UV wavelengths for a single model atmosphere, and with the uncertainty in the range over which to average the model fluxes about the line rest wavelengths (there are quite a few photospheric lines over the range). So it seems reasonable to use just a single value for the model atmosphere UV flux of Hν = 1.8e-3.
We evaluate the relationship between the distance of the X-ray plasma from the photosphere and the f/i ratio using the formalism (and atomic parameters) in Leutenegger et al. (2006). The results are shown below:
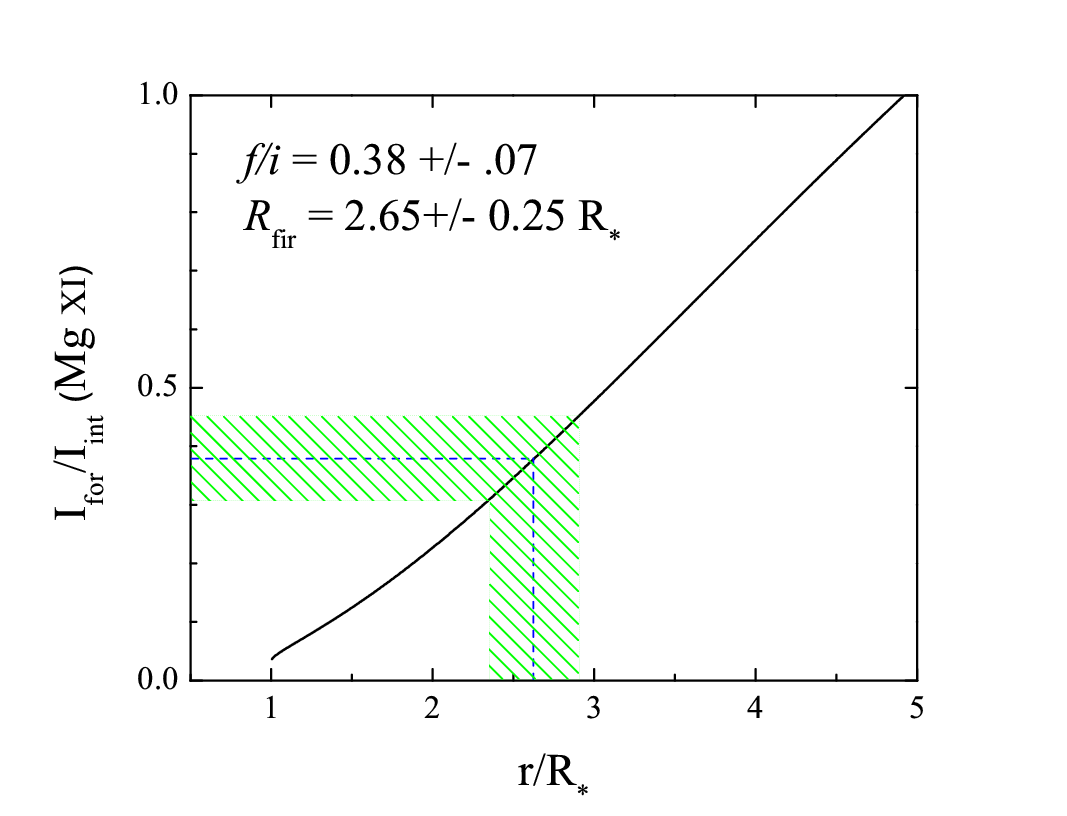
The solid curve represents the theoretical relationship between the formation location and f/i according to eqn. 3 of Leutenegger et al. (2006), using the mean UV photospheric flux, as described above. The vertical dashed blue line corresponds to the best-fit f/i value, derived above, and the green cross-hatched region represents the 68% confidence limits on f/i. The corresponding best-fit location and confidence limits can be read off the x-axis. They are 2.65 +/- 0.25 Rstar.
Incidentally, the altered, but non-zero f/i ratio seen in this line can be contrasted with that expected if the plasma were very far from the star (so f/i = 2.7, its maximum collisional-equilibrium value), here: MEG and HEG, and with the value expected if the plasma were right at the photosphere (f/i = 0.03), here: MEG and HEG. Clearly, neither of these are anywhere close to providing a good fit.
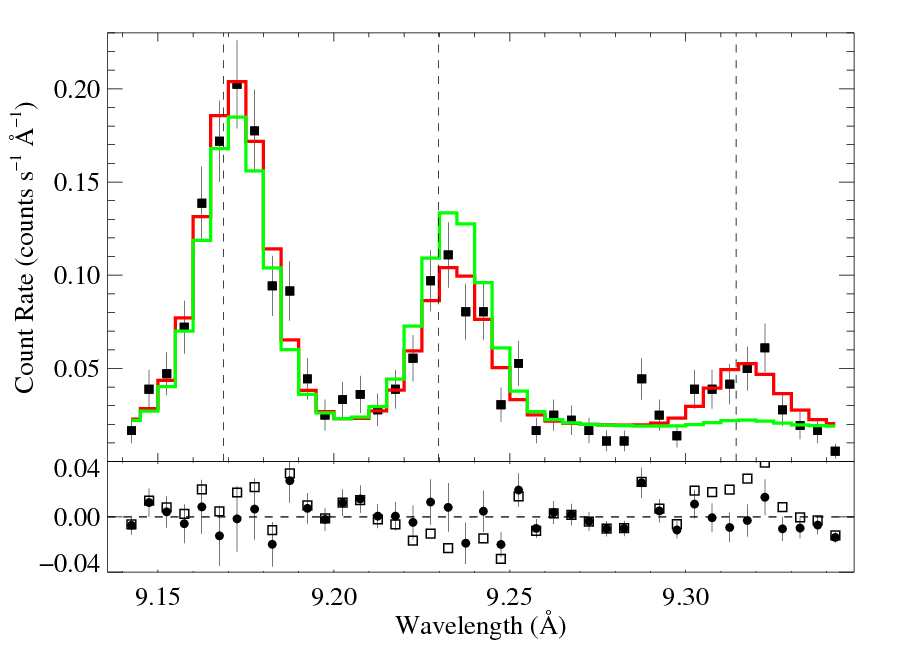
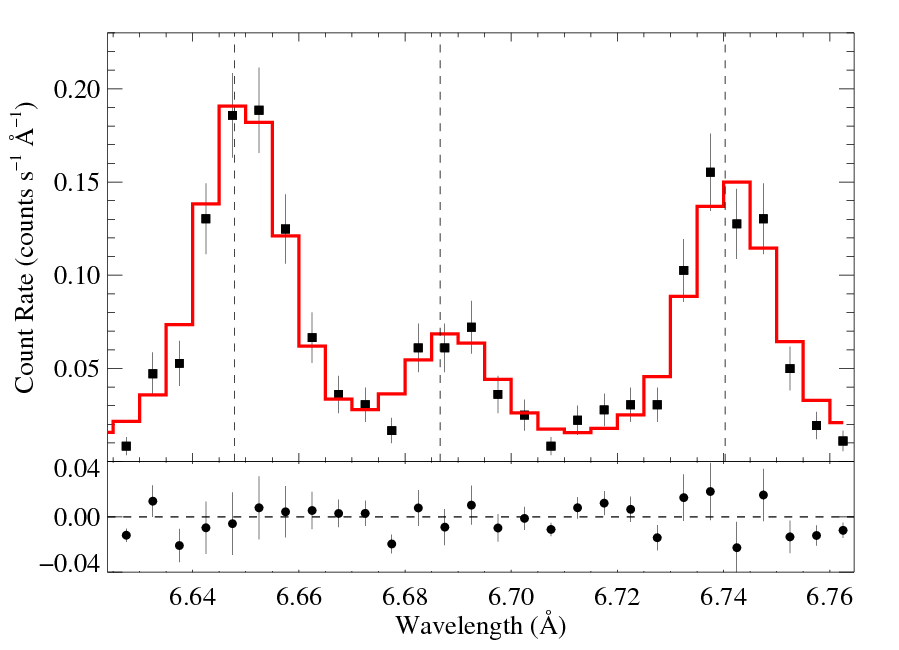
Si XIII He-alpha: 6.65, 6.69, 6.74 Angstroms
MEG
HEG 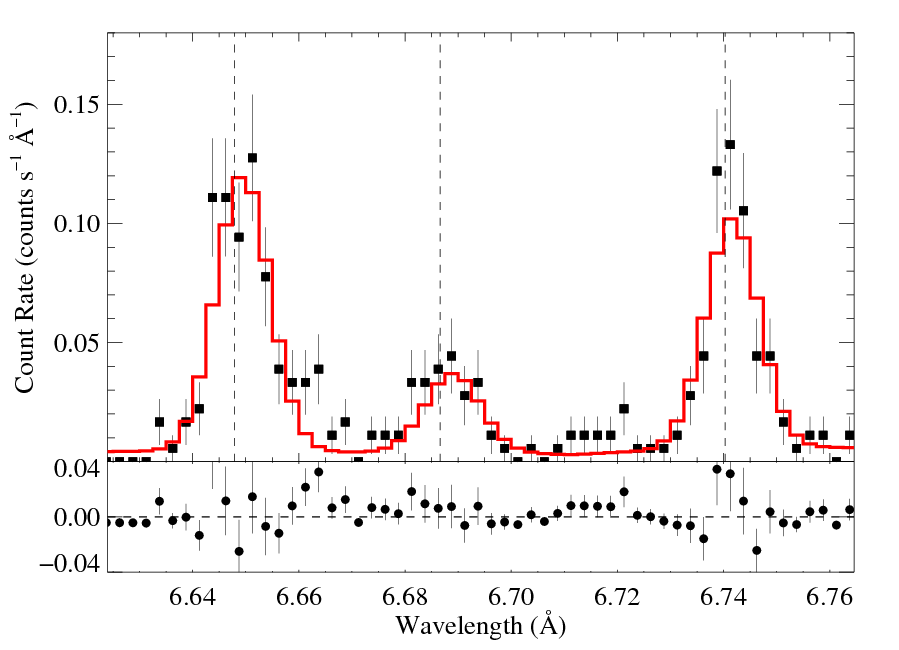
|
[6.62:6.77] R = 2.17 +/- (1.92:2.45; 1.78:2.66 is the 90% confidence range) G = 1.00 +/- (0.93:1.08) v_turb = 153 km/s +/- (132:173) v_shift = 67 km/s +/- (54:80) powerlaw continuum, n=2; norm=1.04e-3 norm=6.81e-5 +/- (6.61e-5:7.14e-5) rejection probability = ?? (C=240.75; N=176) |
For this complex, the R = f/i ratio is consistent with the "low density limit" of Ro = 2.3. In other words, there is no evidence that the ratio is altered by the UV radiation, and thus the measurement provides only a lower limit to the location of the X-ray emitting plasma.
For the Si XIII complex, the wavelengths of the photoexciting transitions are 814.7 and 865.1 Angstroms -- shortward of the Lyman edge -- where the photospheric flux is much more sensitive to the assumed effective temperature. The hotter atmosphere model (Teff = 32,500 K) gives an averaged flux of Hν = 3.4e-4, while the cooler model gives Hν = 1.0e-4. These two values of the assumed UV flux give lower limits to the mean radius at which the X-ray plasma resides of 1.40 Rstar and 2.44 Rstar, respectively. These limits are shown graphically, below, using the 68% lower confidence limit on the measured f/i of 1.92.
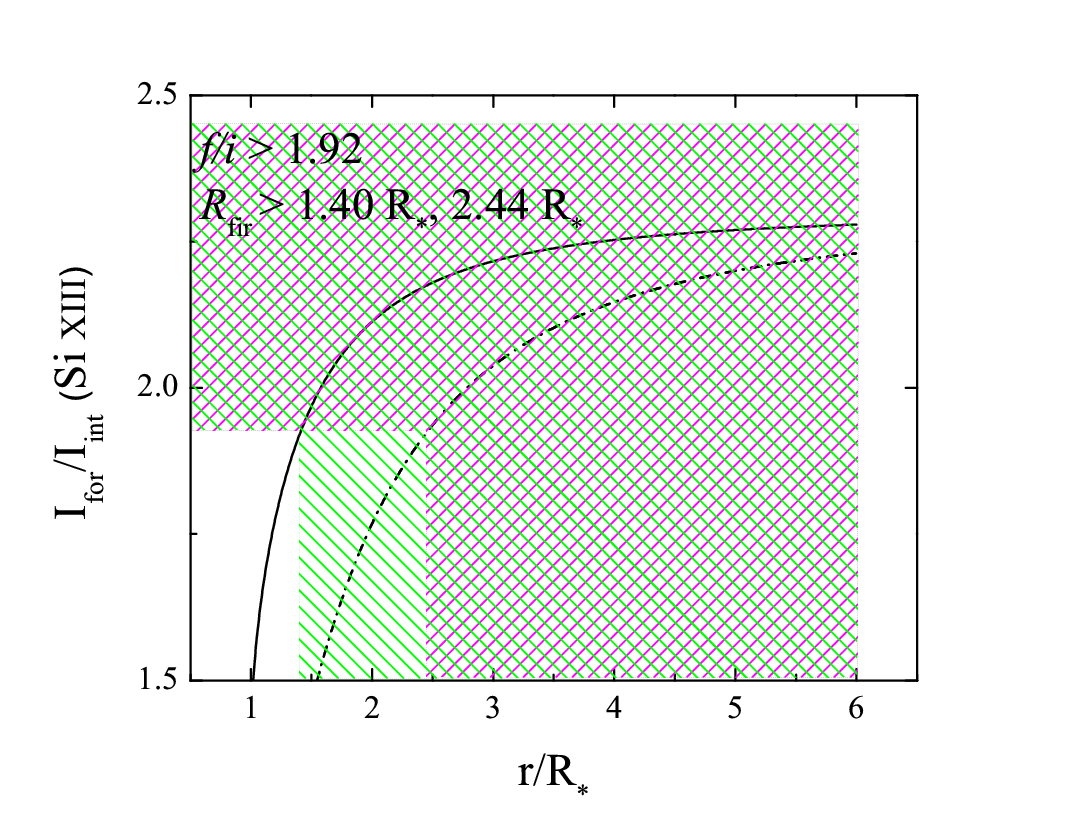
Here the green cross-hatched region represents the lower limit on the formation radius, assuming the cooler model atmosphere, while the pink cross-hatched region represents the limit assuming the hotter model atmosphere.
A log of the spectral fitting is available.
last modified: 6 July 2011