Chandra global spectral analysis of O stars
This project involves the analysis of Chandra HETGS observations of roughly a dozen O stars, in order to determine the temperature distribution in their shock-heated wind plasma (via the APEC family of emission models) and the mass-loss rates of their winds (via X-ray attenuation modeling using windtabs).
Here we present some preliminary, proof-of-concept work on ζ Pup.
To keep things simple, we will at first analyze just the MEG spectrum of the star, and will use just the wavelength range 4.8 to 22.5 Angstroms.
The (unbinned) MEG spectrum (+1 and -1 orders co-added) of ζ Pup
MEG
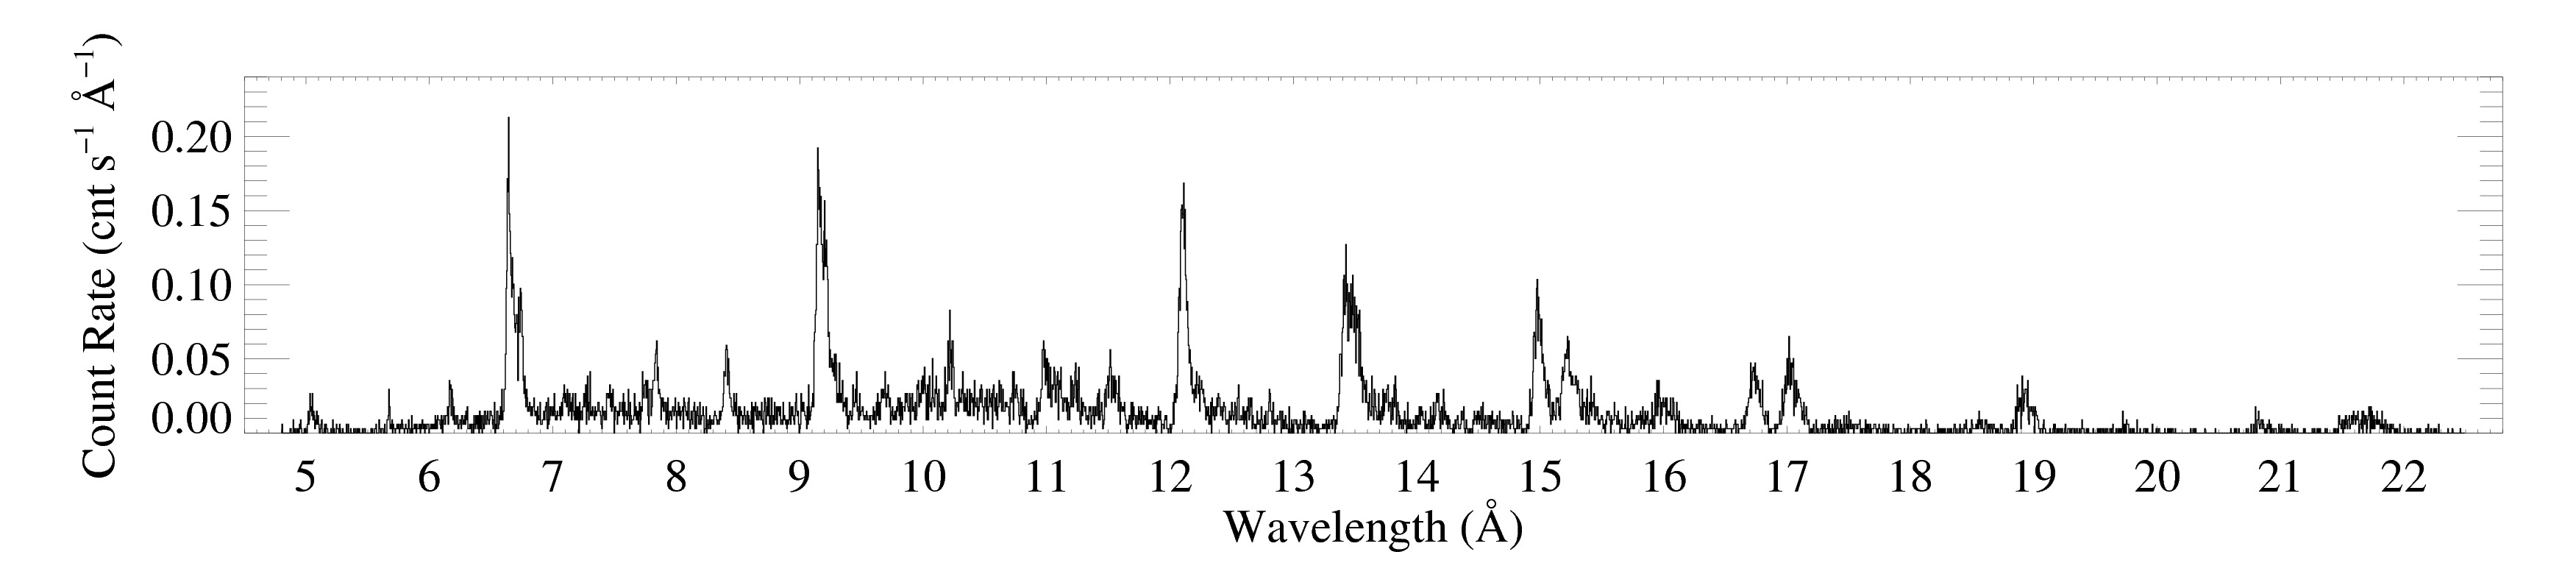
This plot was made from a four-column ascii file (zpup_meg_dataonly.dat) written out from xspec (no model defined, so only four columns). The MEG-1 and MEG+1 spectra were defined as the two xspec datasets, so the output file (made with iplot > wdata) has the two spectra in the same file, separated by a line of "NO NO NO NO"; I made two copies of the output file, edited them by hand so they each contained only one of the spectra (and no header lines). Those two files (zpup_meg-1_dataonly.dat and zpup_meg+1_dataonly.dat) are read in by bigplot_v9b.pro, which coadds them and makes a single histogram plot, shown above. Note that bigplot_v9b calls two other IDL procedures: psopen.pro and psclose.pro.
Our goal is to fit a multi-temperature bapec model to this spectrum, along with models for both interstellar (ISM) absorption (tbabs) and wind absorption (windtabs). But before we can reliably do this, we have to bin ("group") the data. There are several reasons for this: (1) low count bins that sample the continuum will have undue influence on the fit because there are so many of them and they have very small formal error bars; (2) the chi-square statistic is formally valid only for data with Gaussian distributed errors, whereas photon counting statistics are Poissonian — however once there are at least 10 counts in every bin, the errors are well-approximated by a Gaussian distribution; (3) two of the three lines in the He-like complexes have intensity ratios that are altered in the presence of a strong UV radiation field and this effect is not accounted for in apec. We can deal with this in a crude, but effective, way, by simply combining all the bins across the forbidden and intercombination lines in each of these features.
We can group the Chandra data (and the associated ARFs and RMFs) using the ciao task, dmgroup. See the "thread" (i.e. recipe, or set of instructions for using that task) here on the CIAO website. CIAO is the Chandra data reduction software. Note that only pha1 files (fits files containing just a single spectrum) can be grouped, so, as per the thread, we first have to split off the spectral orders we want to analyze into individual files. Then we can group them using dmgroup according to any number of criteria.
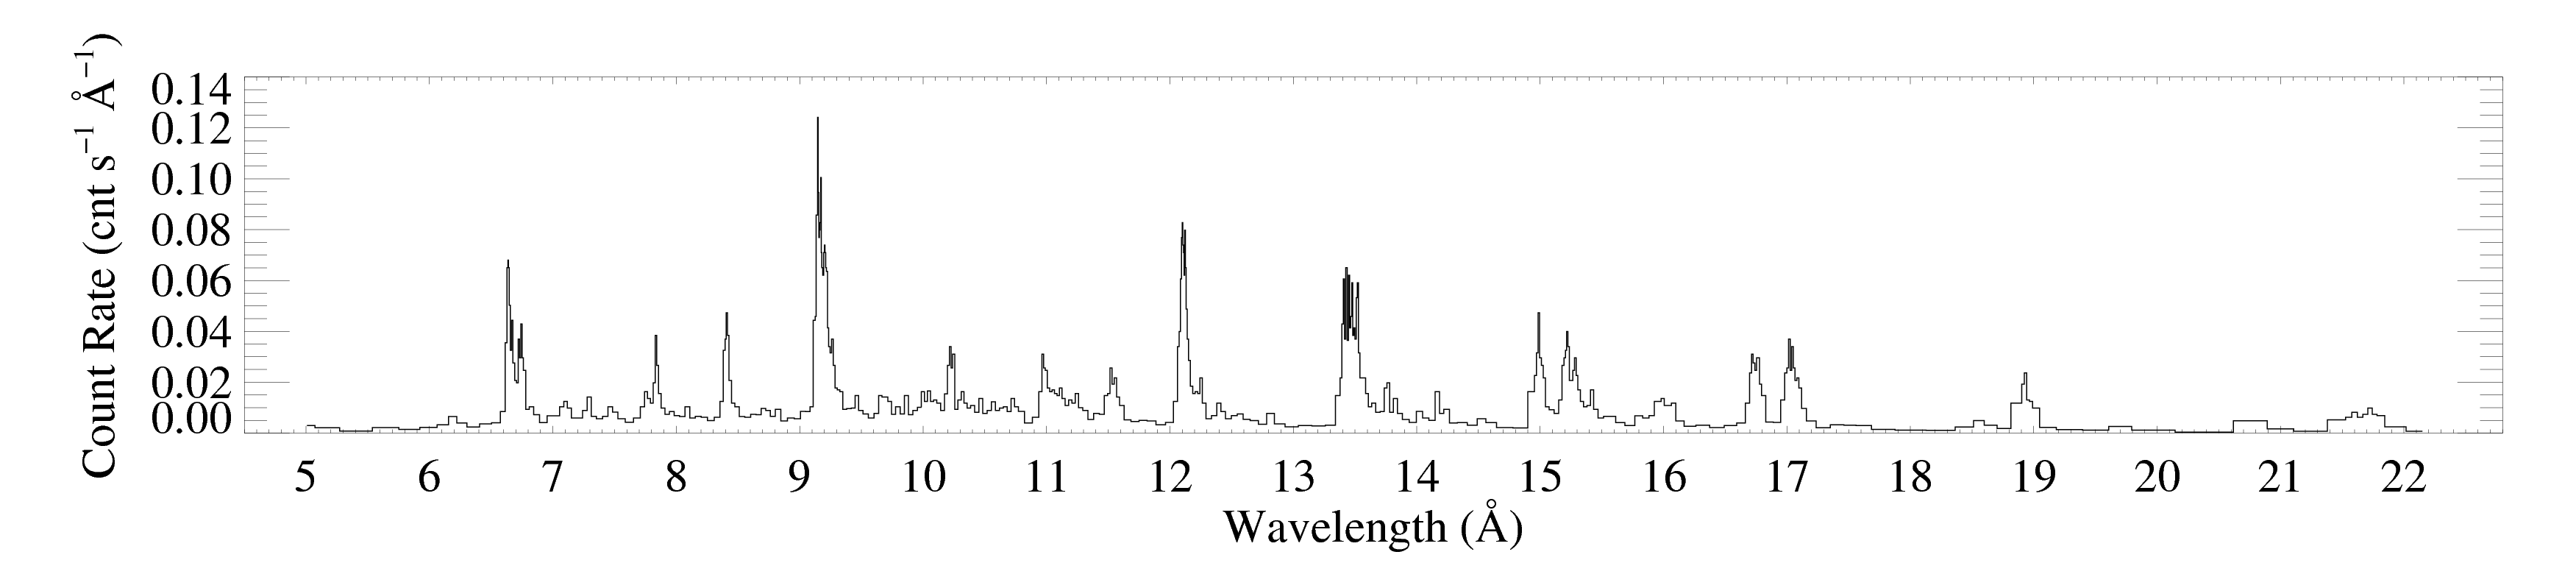
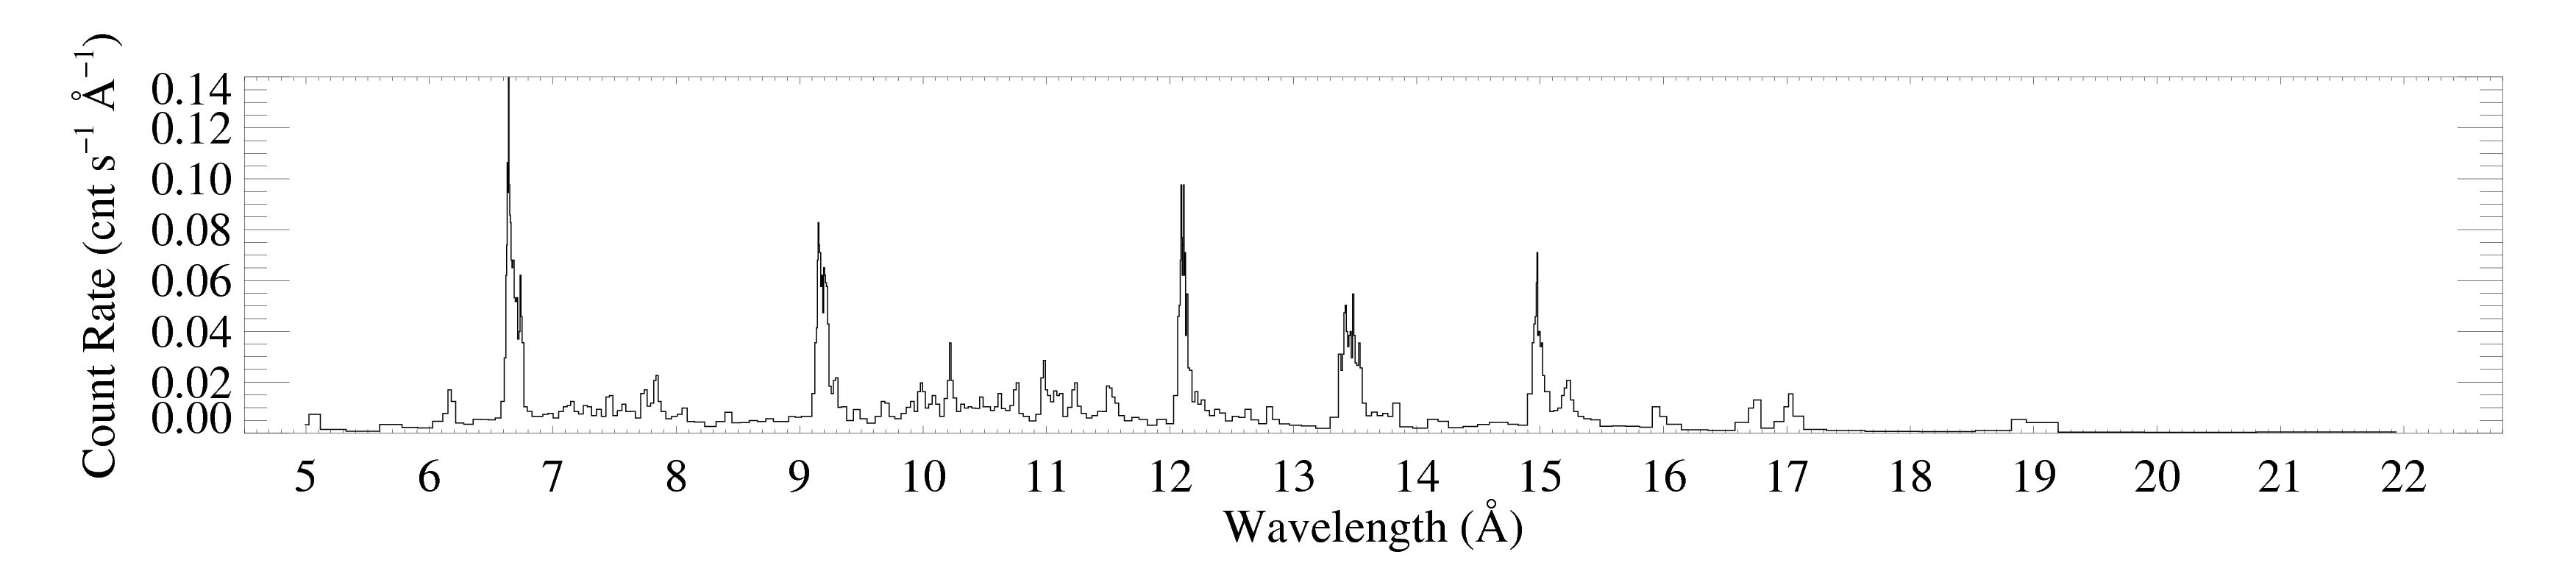
Here are the -1 and +1 order spectra grouped according to the criterion that each bin have at least 20 counts. Since the algorithm will produce a different binning for each spectrum, they can no longer be coadded, as the unbinned spectrum above is. These plots were each made with bigplot_v9.pro.
MEG -1
MEG +1
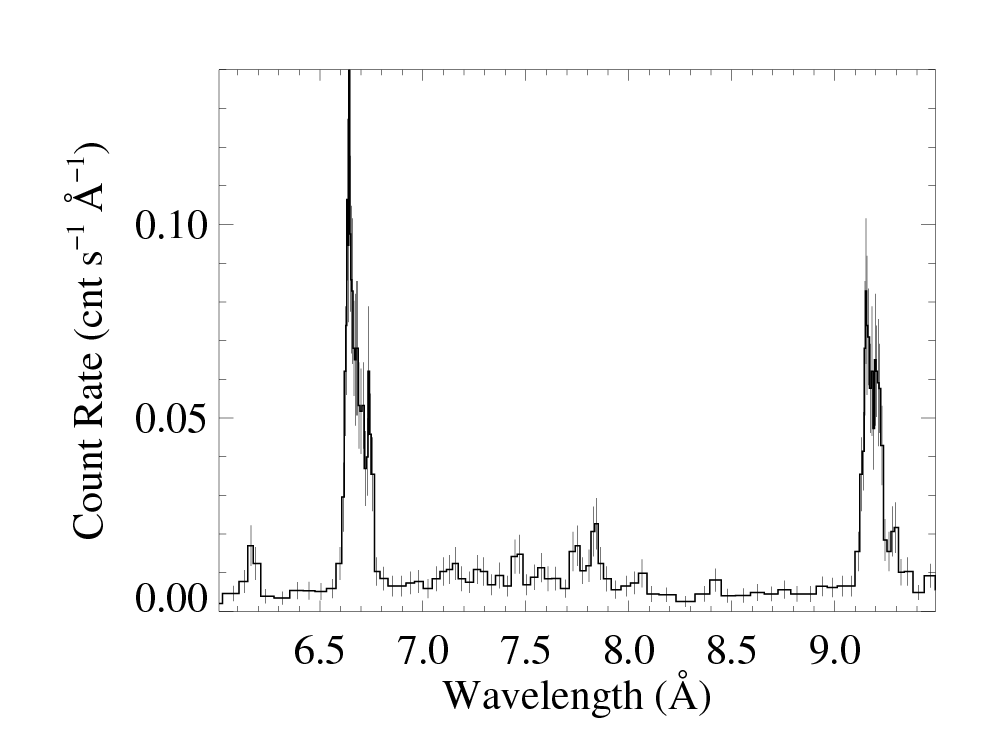
You can clearly see the effects of the grouping, including bins that are different widths, in these zoom in plots on 6.0 to 9.5 A (containing the Si XIV/XIII and Mg XII/XI lines). These plots were each made with medplot_v9.pro.
MEG -1
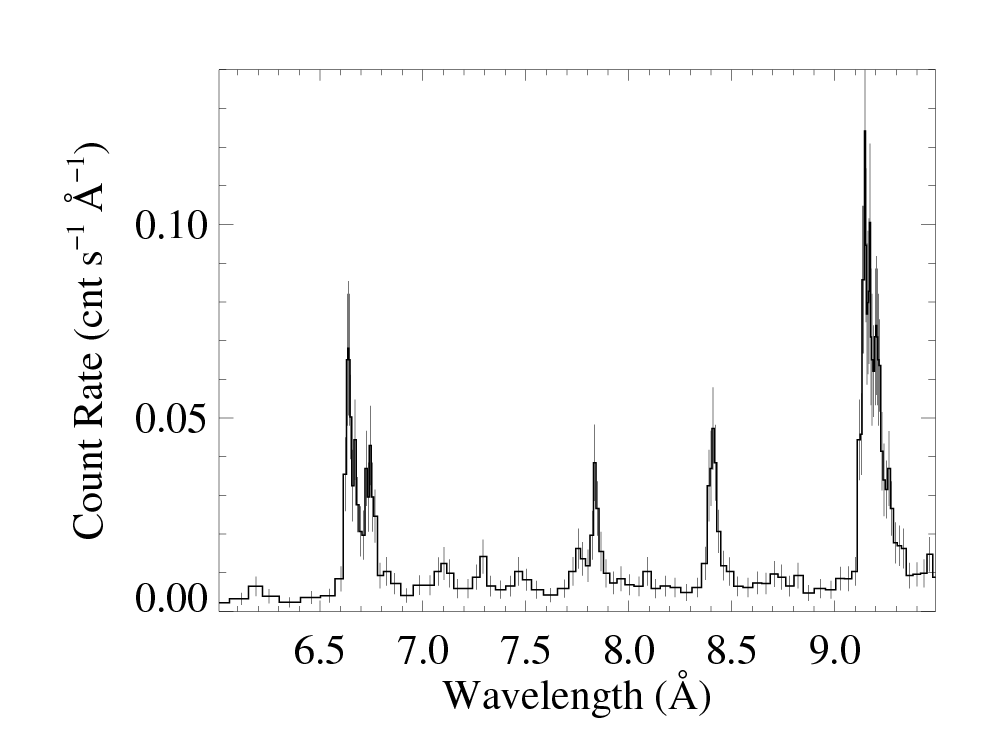
MEG +1
To see a step-by-step set of commands for grouping your spectra, read these notes.
last modified: 11 June 2014