Information for students working with the telescope
at the Peter van de Kamp Observatory
2017-18
Profs. David Cohen and Eric Jensen
Science Center 122 - 125


AstroImageJ softwareAstroImageJ (AIJ) is the software we use for telescope data reduction and analysis, including photometry, and even transit light curve fitting. It is free. You should install it on your computer, and keep it updated. It was written by Karen Collins, and she releases updates frequently. You can do so via the Help > Update menu. And choose "daily build" from the Upgrade To pulldown menu.
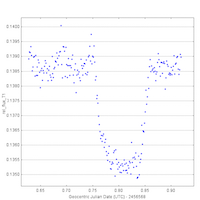
TutorialsYou can read the instructions for data reduction (bias, dark, and flat field calibrations) [v.1.3 pdf], which includes a step-by-step tutorial with real data. These instructions also include information about image processing, which is generally only recreational at this point, but will help you familiarize yourself with the nature of the data from our telescope. Go through this tutorial, and let Eric or David know if you have any questions. To emphasize – exoplanet relevance (data reduction) is only the first seven pages of this tutorial. Pages 14 and 15 have useful information about different filters, too. But p. 8 onward is about imaging and making multi-color composite images and is not relevant to exoplanet work. Note that the data reduction instructions/tutorial was written using an earlier version of AIJ, so you might notice some minor differences between what's shown in the tutorial and how AIJ behaves for you. After you have the data reduction done, you can read the instructions for aperture photometry, including making a light curve [v.1.0 pdf]. These instructions also include a tutorial using real data – in this case for the exoplanet WASP-11b, which produces a transit with a depth of 2 percent. The photometry to make the light curve is quite straightforward in this case. You should then try doing the photometry on another exoplanet (candidate) host star identified by the KELT consortium [pdf or MS Word]. The Word version might be useful because you can expand embedded images of screenshots in order to make them more legible. Doing the photometry on this star is more challenging, as the instructions describe, and will provide you with the opportunity to learn more of AIJ's useful capabilities. Furthermore, you will also fit a transit model to the light curve and derive some important properties of the system. You should show David or Eric your work on this KELT candidate's light curve before moving on to analyzing new data. We have an extensive set of Google Slides with information about all aspects of exoplanet observing and data analysis. Get in touch with David and he can share these slides with you. They are a work in progress and student members of the research team should feel free to edit and/or add to them, though it's a good idea to let David or Eric know when you do so. Linked from those slides is a condensed guide/tutorial on data reduction and analysis, which is somewhat redundant with the first two tutorials linked above, but is more streamlined and may be a good alternative place to start or to remind yourself how do do various tasks.
Next stepsAfter going through the three tutorials you should have the basic skills to reduce and fit photometry from exoplanet transit candidates. And we can give you more datasets to practice on (please contact David or Eric when you're ready for this). Among other things, as you work with more data you'll get a feel for how to best choose comp stars and how to optimally set your aperture sizes and other aspects of the art of working with these sort of data. You'll also learn more about the transit light curve fitting and the input and output parameters, and you'll have the opportunity to learn and think about the physical properties of these systems, which is, after all, the essence of the science we're doing – discovering and characterizing the properties of exoplanets around bright host stars. We will also teach you how to plan your own observations, using TAPIR and/or the KELT observation planning tool. And we will teach you to write scripts that run the telescope and camera in order to make a night's observations. We will also teach you how to physically open (and close) the observatory. (Please contact David or Eric when you're ready for this.) With the skills described above, a student could choose a target to observe for a given night, open up the telescope and script the night's observing, retrieve the data in the morning, and reduce and analyze the data, producing a light curve less than 24 hours after planning the observations. Again, information about all these steps is available on our group's set of Google Slides, linked in the last paragraph of the above section (Tutorials).
HelpDavid and Eric will have regular office/lab hours during which you can drop in for help with data analysis. These will be announced at the beginning of the fall semester. In general, feel free to contact David or Eric in person or by email if you have any questions about any aspect of the work with the telescope and data.
Background informationYou can read information about the KELT collaboration and also about research we've published based on observations we – and students – have made with the telescope.
|
Office hoursTo be announced at the beginning of the fall semester 2017.
Observing and data analysis resourcesairmass plotter from Tapir annotated finding charts also from Tapir AstroImageJ (AIJ) telescope data analysis software astrometry.net upload an image or use within AIJ planets, Moon, Sun rise and set times (we are near 40 deg N and 75 deg W) |
This page is maintained by David
Cohen
cohen -at- astro -dot- swarthmore -dot- edu
Last modified: June 18, 2017