

X-ray Line Profiles of Magnetically Confined Hot-Star Winds
Stephanie K. Tonnesen1, David H. Cohen1, Stanley P. Owocki2, Asif ud-Doula2,3, Marc Gagne4, Mary Oksala4
(1) Swarthmore College, (2) Bartol Research Institute,
University of Delaware, (3) North Carolina State, (4) West Chester University
Magnetic Hot Stars
Hot Star X-rays
The
standard model of hot star wind emission explains many X-ray observations
of O stars (see Roban Kramer’s poster (113:05)): Broad
and asymmetric lines, due to Doppler-shifted emission from
shock zones embedded in the radiation-driven winds, affected
by continuum absorption in the cooler component of the wind.
But
observations of some hot stars, including q1 Ori C, cannot be understood
in the context of the standard wind shock model:
1.Lines are quite narrow.
2.They are relatively unshifted and symmetric.
3.The X-ray emission is hard.
4.And modulated on the rotation period
(such that occultation by the star seems to be the cause of
reduced X-ray emission at certain phases).
Line
Profile Simulations
X-ray
Lightcurve
0

An 1100 G magnetic field
has been detected on the O7 V star, q1 Ori C (Donati et al.
2002).
This star is a strong X-ray
source with very hard X-rays (Schulz et al. 2000) modulated
on the 16 day rotation period (Gagne et al. 1997).
Based on the Zeeman magnetic
field detection, UV and optical line strength variability, and
X-ray variability, the following picture has emerged of the
geometry of this star’s circumstellar matter:
Babel
and Montmerle proposed the Magnetically Confined Wind
Shock model (1997) to explain the hard X-rays seen in q1 Ori
C. In this model, a radiation-driven
wind is forced to flow along magnetic field lines, leading to a
collision of oppositely directed flows at the magnetic equator,
and the associated shock heating of the confined gas. This leads to an X-ray magnetosphere
of relatively slow moving hot gas.
In these calculations, the field is
assumed to be completely rigid.
Note also, a post-shock
cooling disk forms in this steady-state model.
This disk may be a significant source of X-ray opacity.
Note
that due to the tilt of the field and the viewing
inclination angle, there is a
phase dependence of the view with respect
to the magnetosphere. We indicate the four phases for
which we have Chandra observations.
Modeling Line Profiles
New MHD simulations of magnetically
confined winds (ud-Doula and Owocki 2002) go beyond the
Babel and Montmerle model in that they allow for the relaxation of the
magnetic field structure based on the kinetic energy of the
wind flow.
Crucial parameter for
magnetic confinement is h*,
proportional to the ratio of the magnetic energy density
to wind kinetic energy density.
Note the the equator-ward
flow in the confined loops
The shock velocity
corresponds to temperatures above
50 million K
These recently calculated
models are specific to q1 Ori C and include post-shock radiative
cooling. We post-process these simulations to produce line profiles, as seen from
arbitrary viewing angles (corresponding to different rotation phases), in the
next columns to the right.
We calculate the emissivity
at each grid zone based on the simulation temperature and density. The line-of-sight velocity determines the
wavelength of the emission.
We take occultation by the
star into account but not (currently) X-ray absorption by the
cold wind component.
Note that these simulations
show that cooler post-shock gas periodically falls back onto
the star, and so a dense, opaque cooling disk does not readily
form. Furthermore, not all
of the hot gas is in the closed magnetic structures, but rather in the
interface between the confined equatorial gas and the wind.
Below we show synthetic line
profiles post-processed from the MHD simulation snapshot shown at
the bottom of the previous column.
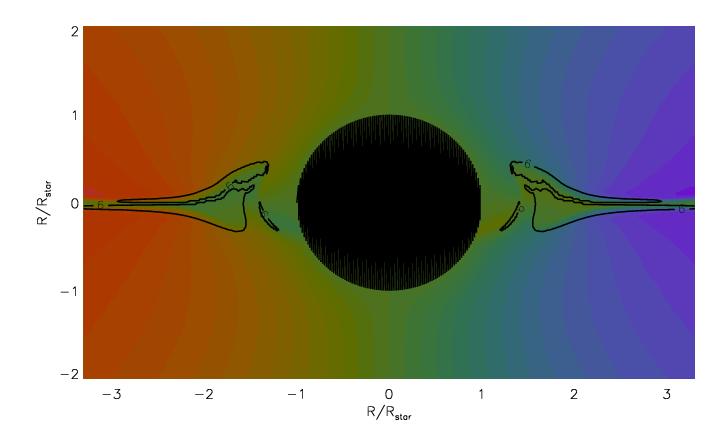
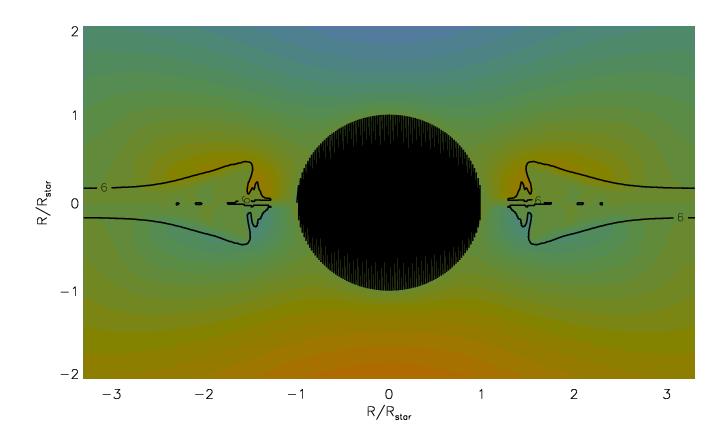
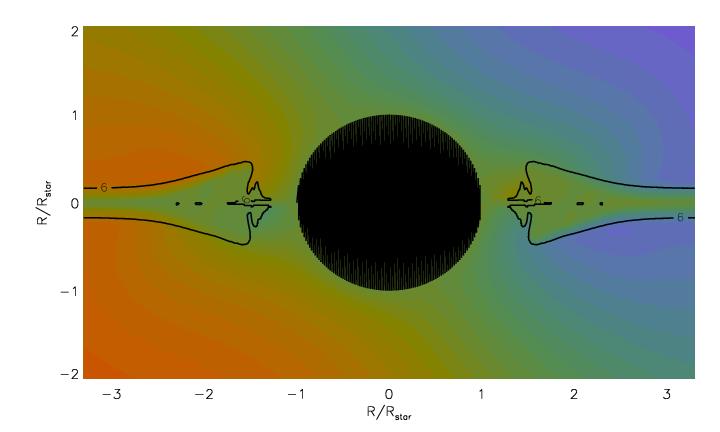
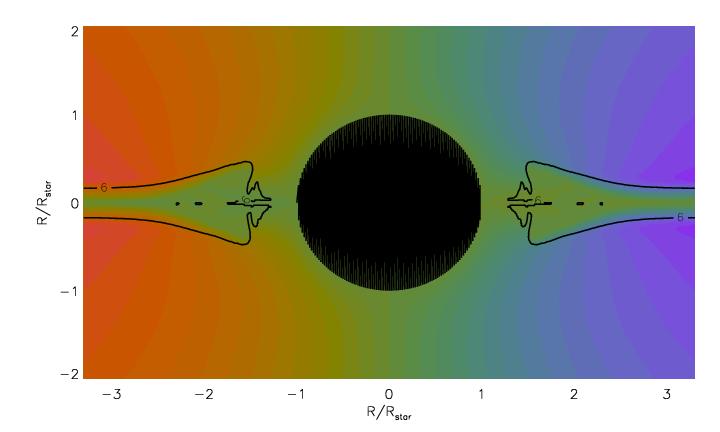
We show profiles as seen from
0˚ (pole-on), 45˚ and 90˚ (equator-on). For each view we show two
profiles: including occultation by the star and not including
occultation. We also show the
corresponding line-of-sight velocity contours (color plots on
right), with the contours of hot (T>106 K) plasma superimposed.
Line of Sight Velocities
Scale in terms of UV-based vterm=2500 km
s-1


Density
Temperature
MHD Simulations of q1 Ori C with
energy equation (radiative as well as adiabatic cooling)
Initial MHD simulations:
isothermal, but large shock at equator


We
first explore line profiles from non-spherical winds by considering
a disk (opening angle 20˚) with a purely radial outflow.


Pole-on view,
0°
45° view
Equator-on view, 90°
NOTE: expect strong viewing-angle dependence
of line-profile.
Speed
Strong magnetic confinement of the
wind, but geometrically thick shock
zone and relatively little ‘cooling disk’
Emission Line Profiles
The
magnetosphere periodically empties
as material falls back onto the star, leading to more irregular structure in the X-ray emission region
A different snapshot in the MHD simulation shows a dense ‘disk
infall’ back onto the star

The
X-ray and Ha emission
maxima, magnetic field maximum, and UV absorption
minimum occur at phase=0.0.
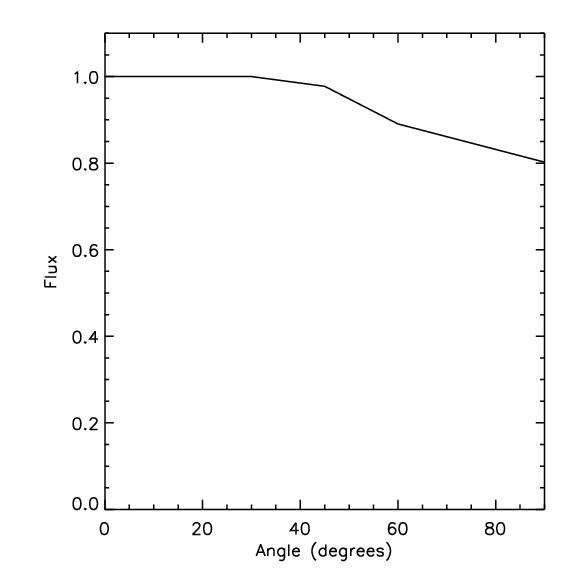
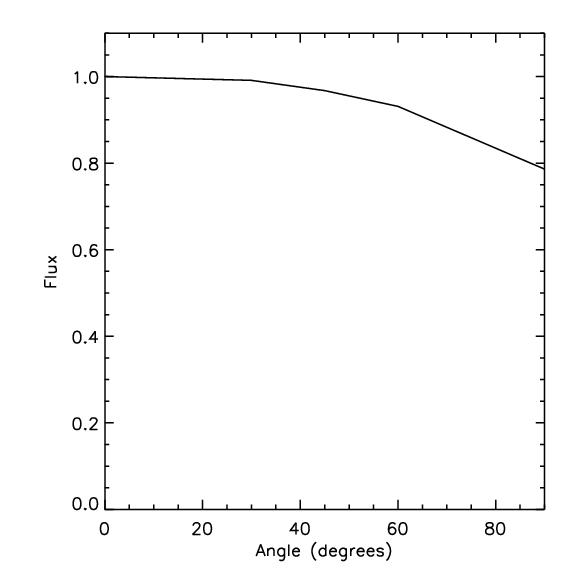
Overall X-ray flux
synthesized from the same MHD simulation snapshot. The
dip at oblique viewing angles is due to stellar
occultation.
Data from four different Chandra
observations is superimposed: green squares
represent the relative fluxes in the strong lines near 5 Å
while purple circles represent the relative fluxes
in the strong lines between 10 and 15 Å, where absorption is
likely to be more important.


Speed
Density
Temperature
X-ray
Lightcurve
Conclusions
•Dynamic and quasi-steady hydrodynamics both lead to similar X-ray line profiles and overall emission properties.
•Emission lines are indeed very narrow, and
•They vary only slightly with phase/viewing angle.


Thin color bar at top and bottom of spectral line profiles indicate the velocities that correspond to a given location in the line.


Poster
available at astro.swarthmore.edu/~cohen/posters/stephanie_aas.ppt, .jpg
