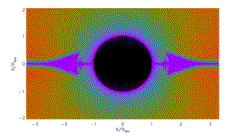


speed
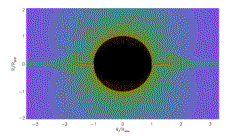
density
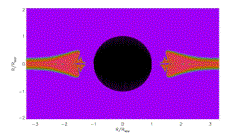
temperature


We looked at some
snapshots from these simulations and synthesized line profiles (and emission measure distributions and light curves)
Note:
throughout, the speed is in terms of an assumed terminal speed of 2500 km s-1
This first snapshot of q1 Ori C is from a time when the hot plasma
is relatively placid, filling the closed
loop region