Quantitatively sum up the area under the two curves
in figures and to confirm the area underneath the DANTE spectrum does not equal the
area under the witness plate curve.
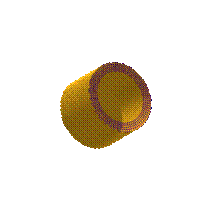
Perform a new simulation with a lip on the
halfraum (Figure 17).
Perform a new simulation where the albedo of the
witness plate is lower than the albedo of the halfraum.
Create a histogram of solid angle versus
temperature.


Figure 17
Where do we go from here?