The
area under the spectral curves checks out: We compared the ratio of fwp/fdante to (Twp/Tdante)4 and found good agreement (see next slide).
Log plots can be misleading.
But,
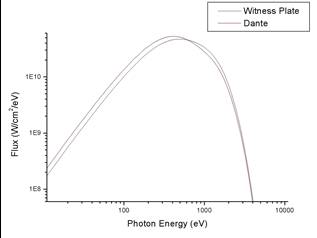
by the same token, the spectral energy distributions are different, even when the overall radiation temperatures are the
same.
DANTE sees more soft emission, while the witness
plate spectrum is harder.