Exploring the effects of background subtraction
For the purposes of this exercise, we will fit the Fe XVII line at 15.014 over the wavelength range [14.87:15.13] using the MEG data only, and assume a terminal velocity of 2250 km/s - the baseline model.
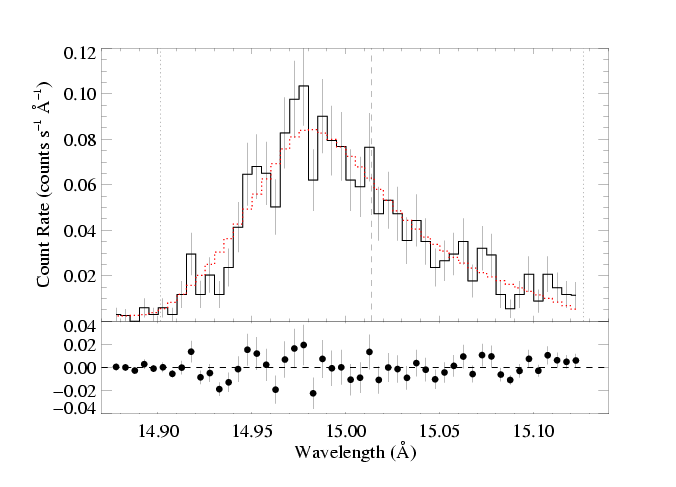
Here is the baseline model fit, shown on the main page and other sub-pages. The standard background is subtracted from the data prior to performing the fit. Note that this is not formally valid when the C statistic is being used. But we do it anyway (there's not a really good way to handle the background with the C statistic, unless you can fit it with a reliable model).
|
[14.87:15.13]
vinf=2250 β=1 powerlaw continuum, n=2; norm=1.91e-3 q=0 hinf=0 taustar=1.97 +/- (1.63:2.35) uo=0.655 +/- (0.605:0.725) norm=5.24e-4 +/- (5.04e-4:5.51e-4) rejection probability = 19% (C=95.11; N=102) |
And here's the fit when we do not subtract the background:

|
[14.87:15.13]
vinf=2250 β=1 powerlaw continuum, n=2; norm=1.91e-3 q=0 hinf=0 taustar=1.98 +/- (1.64:2.37) uo=0.657 +/- (0.605:0.729) norm=5.27e-4 +/- (5.07e-4:5.58e-4) rejection probability = 21% (C=96.00; N=102) |
The results (confidence ranges too) are nearly identical. The normalization is a tiny bit larger, as would be expected, if the background isn't subtracted. But the effect is very, very small. We can try this again when we are looking at data with worse S/N.
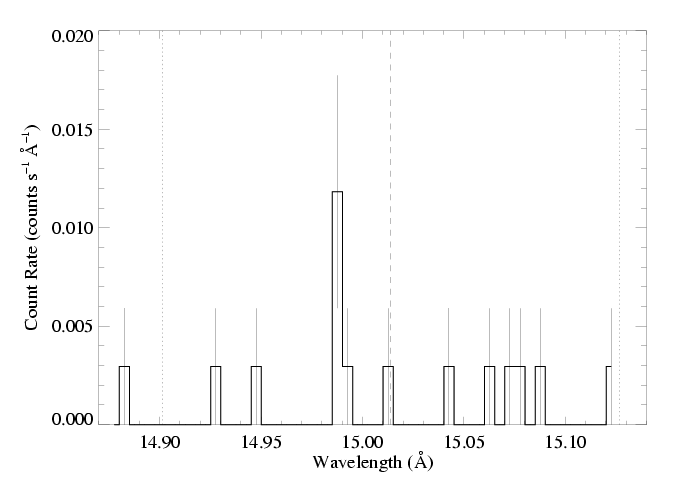
Finally, let's have a look at the background spectrum itself, to verify what the differences are between the two spectra. (The data in the two figures sure don't look that different.)
And on the same scale as the data above
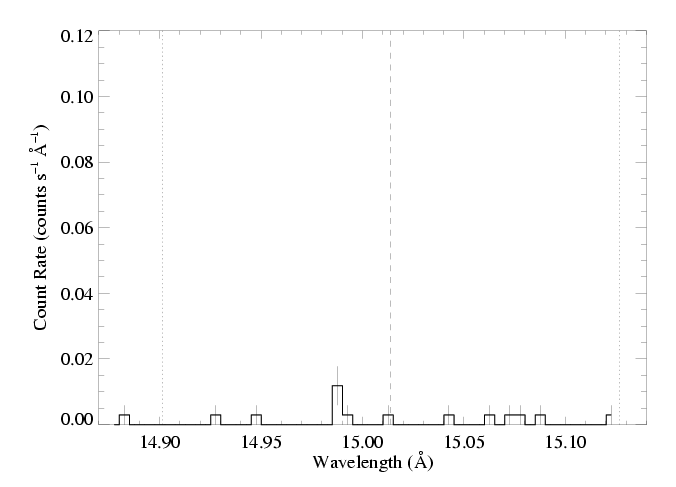
The aperture over which the background is sampled is bigger than the source aperture and this representation shows the total counts/bin over that aperture. This factor is accounted for when the background spectrum is subtracted from the source, but not when it is plotted as the source (as we do here). Once the scaling is applied, the background count rate is very, very low. In fact, you can only see the difference between the top two plots on this page in the one bin with more than one background count.
Hmmm... maybe we should not be subtracting the background before fitting the data. If the background is weak and featureless, then subtracting it only adds to the noise, not the signal, and if it also formally invalidates the C statistic... then why do it? Maybe for all lines other than 15.014 (which we've fit already), we will not subtract the background.
Back to main page.
last modified: 25 April 2008