Confidence limits on line profile fits
Looking at models that are at the 68% confidence limit
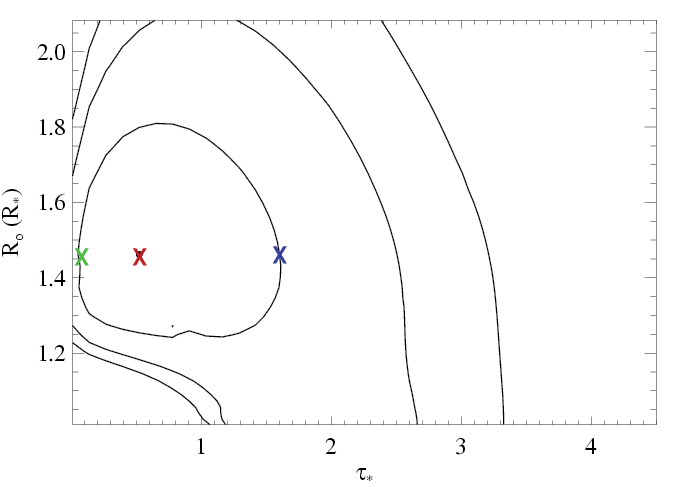
Here we look at models that differ from the best-fit models for two particular lines. For each line, we've chosen two other models which both lie on the 68% confidence contour in the two-dimensional taustar-Ro parameter space, and overplotted those models (having optimized the normalization) on the data along with the best-fit model.
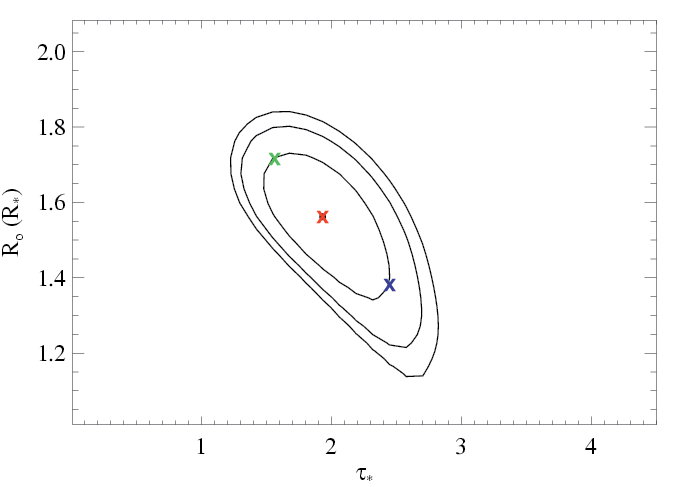
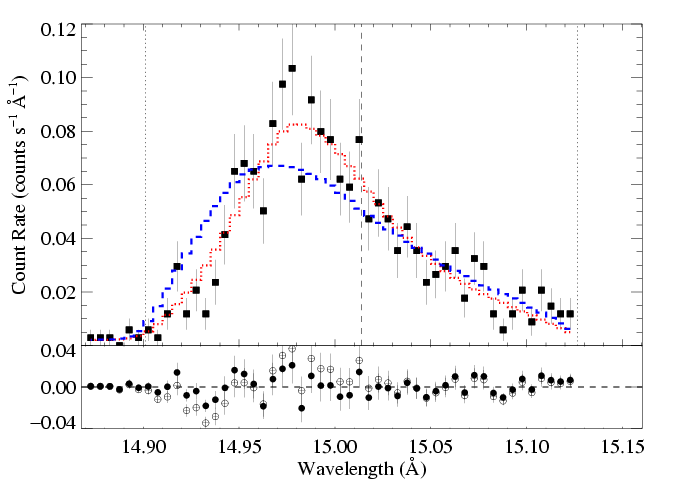
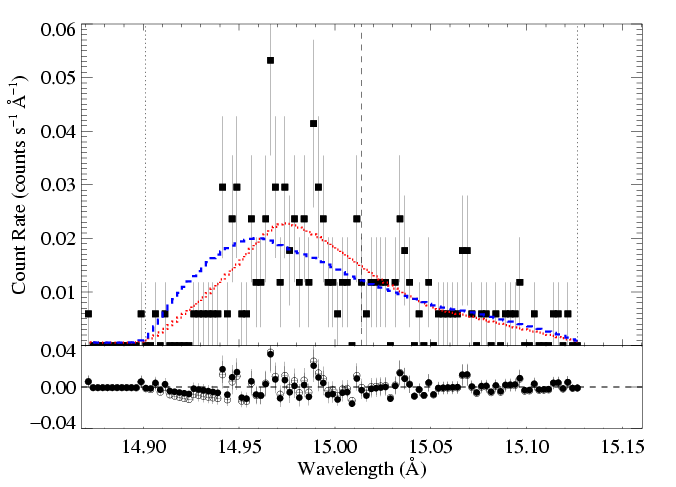
Fe XVII 15.014 A
Here is the canonical, high signal-to-noise line. The constraints on the profile model parameters are pretty tight for this line. Below, we show the confidence limits (same as on the page dedicated to the fits to this line), and indicate the best-fit model with the red X, and choose two additional models - one with higher taustar and one with lower taustar - indicated by the blue and green Xs, respectively.
|
Then, for the models represented by the blue and green Xs, we allow the other parameters (here, just the normalization) to be free, and refit the data, holding taustar and Ro fixed at the indicated values. The C statistic values for these fits are about 2.4 higher than that of the best-fit model. This defines the 68% rejection probability criterion. Below, we show the higher taustar model (the blue X) along with the best fit model (red X), as blue and red histograms, respectively:
MEG

HEG 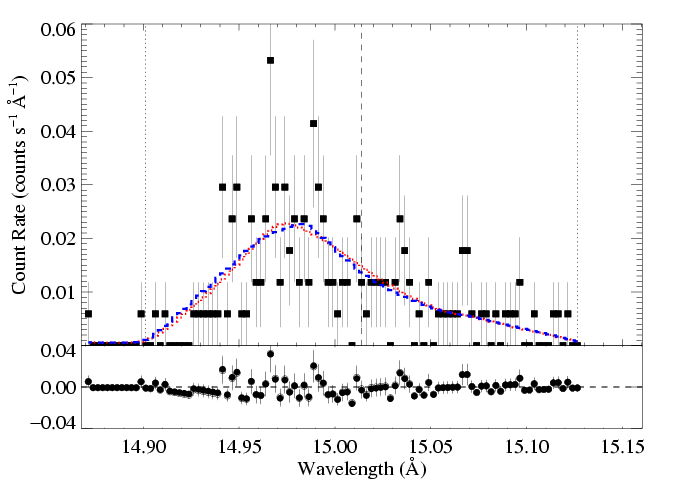
|
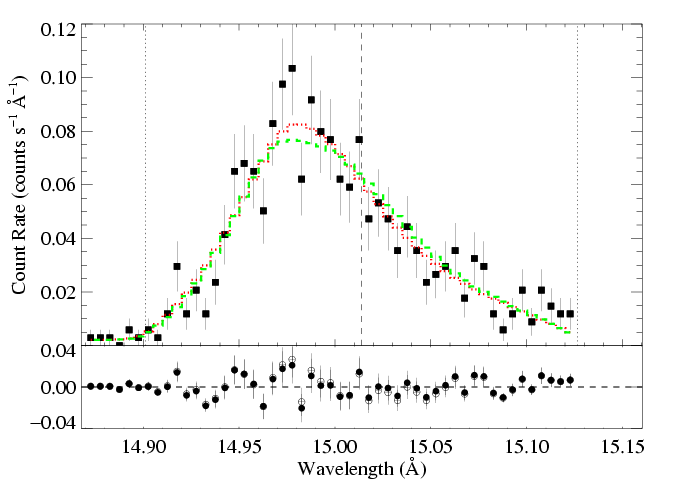
And here, we show the lower taustar model (the green X) along with the best fit model (red X), as green and red histograms, respectively:
MEG
HEG 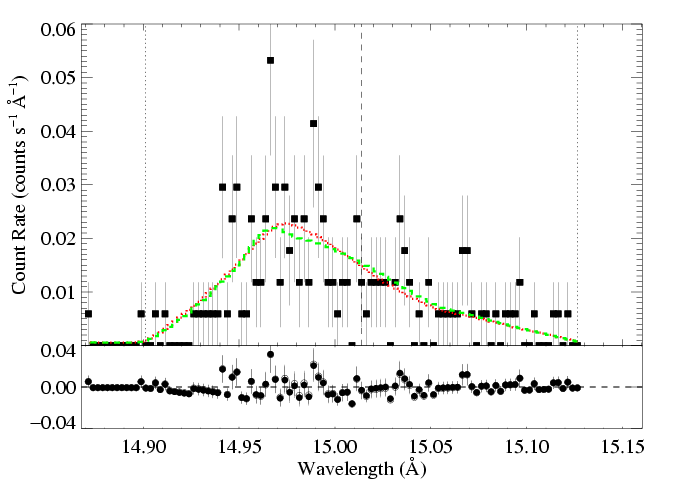
|
The differences between these two models are, indeed, very small. A few points to bear in mind:
- The green and blue models are not bad fits, they're just not as good as the best-fit model.
- More formally, given the type of model (OC2001 profile model with three adjustable parameters) and the data (assuming random Poisson errors only), there's a 68% likelihood that the "true" model ("parent distribution") lies within the first contour.
- We are not claiming that the blue and green models can be rejected outright, just that the red model is preferred (at 68% confidence).
Of course, models that lie further from the best-fit model in parameter space will generate profiles that differ more from that produced by the best-fit model. But even a model lying on the 90% confidence contour won't be much worse than what we're showing here. You can have a look at a model that lies in the extreme lower right hand corner of the confidence region plot: that is, the model with taustar=4.58, corresponding to the literature mass-loss rate: [MEG and HEG].
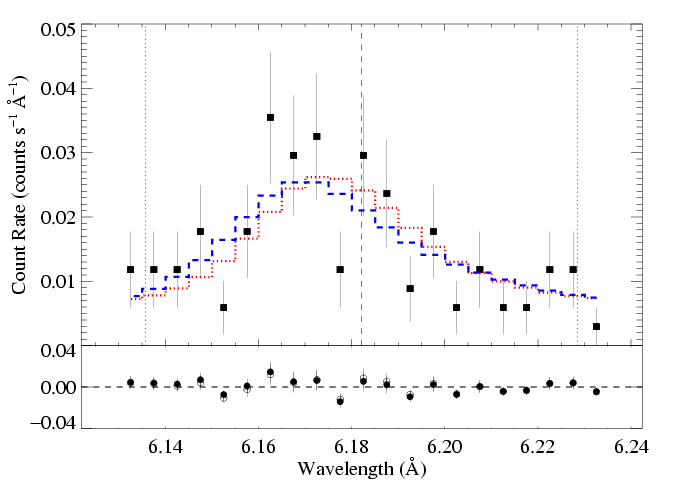
The 68% confidence models are more discrepant when we look at poorer-quality data. Below, we repeat this exercise for the Si XIV Lyman alpha line.
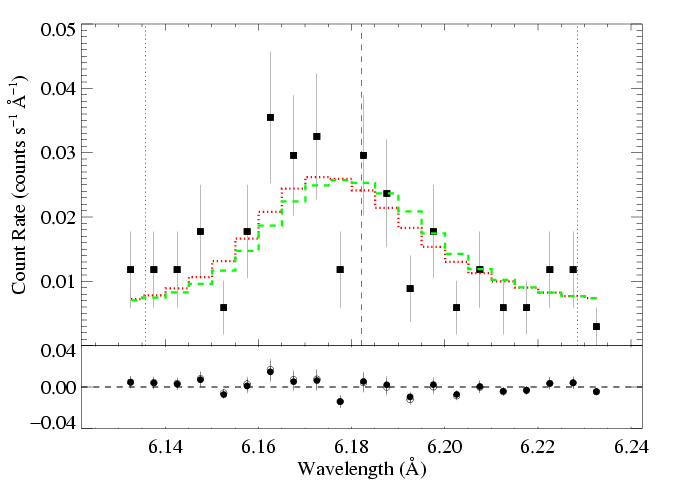
Si XIV 6.1822 A
The constraints on the profile model parameters are looser for this line. Below, we show the confidence limits (same as on the page dedicated to the fits to this line), and indicate the best-fit model with the red X, and choose two additional models - one with higher taustar and one with lower taustar - indicated by the blue and green Xs, respectively.
|
Below, we show the higher taustar model (the blue X) along with the best fit model (red X), as blue and red histograms, respectively:
MEG
HEG 
|
And here, we show the lower taustar model (the green X) along with the best fit model (red X), as green and red histograms, respectively:
MEG
HEG 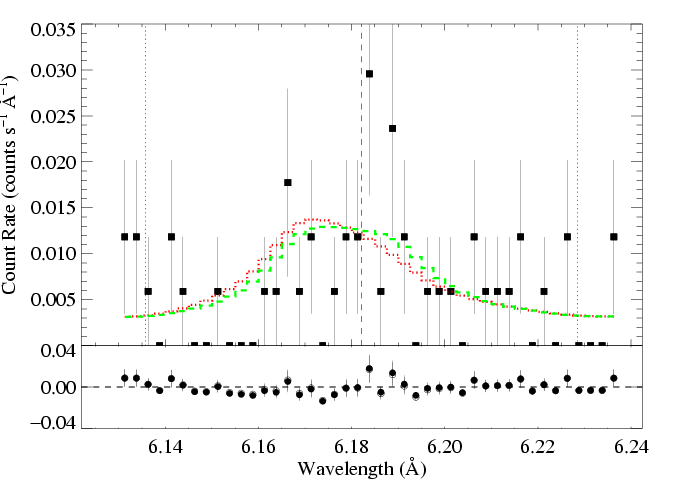
|
The differences among the models are more significant here. That's because the lower-quality data doesn't provide as strong a constraint.
Again, these green and blue models can't be rejected. They provide good fits. Just not as good as the best-fit model. (But even so, the best-fit model is preferred over the blue and green ones at only the 68% confidence level. We can interpret this statement as, 'There's a nearly 1/3 chance that the true model corresponds to the green or blue histograms/Xs, and a 2/3 chance that it's closer to the red histogram/X.')
Finally, we note that these fitting results are not an artifact of the fit statistic. We get nearly identical results using the chi squared statistic with Churazov weighting.
Back to main page.
last modified: 10 January 2009