O VIII 16.006 Angstroms
summary of the data
Note: We fit only the MEG data. There are 237 MEG counts in the spectral region we fit (and plot below). See the fitting log.
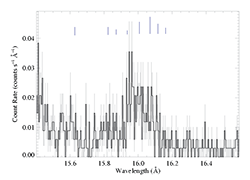
View the spectral region near the line: MEG. There are numerous weak Fe XVIII lines blueward of 16.006, and also blended with the O VIII line at 16.006. We list the wavelengths and relative peak emissivities of the Fe XVIII lines at the top of the fitting log, and show them on the spectrum below, indicated by vertical blue lines whose lengths are proportional to their emissivities.

|
The Fe XVIII lines at 15.63 and 15.82 are present, so the even stronger line at 16.07 that's blended with the O VIII line at 16.006 must be significant. And the lines at 16.11 and 16.00 are too. It's impossible to know precisely how strong, so the analysis of this line will not be reliable. The fitting log shows the results of fitting a single line at 16.006 to the blend of that line and the Fe XVIII lines.
Back to main page.
last modified: 5 July 2008