Exploring the effects of q - a radially-varying filling factor
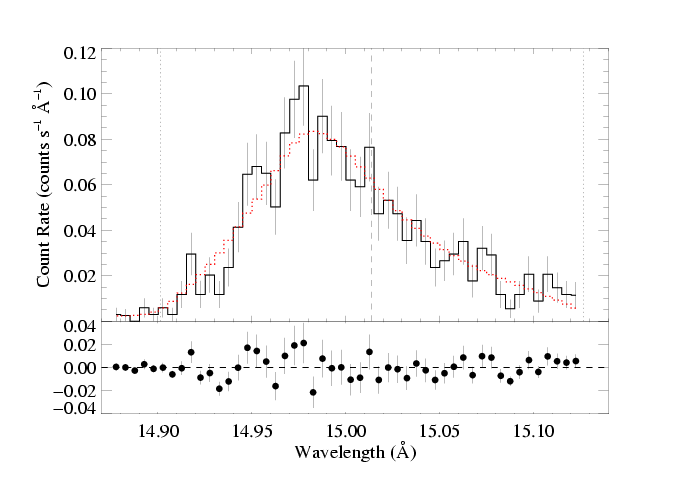
For the purposes of this exercise, we will fit the Fe XVII line at 15.014 over the wavelength range [14.87:15.13] in the MEG data only and assume a terminal velocity of 2250 km/s - the baseline model (with the weak background subtracted).
Here is the baseline model fit, shown on the main page and other sub-pages.
|
[14.87:15.13]
vinf=2250 β=1 powerlaw continuum, n=2; norm=1.91e-3 q=0 hinf=0 taustar=1.97 +/- (1.63:2.35) uo=0.655 +/- (0.605:0.725) norm=5.24e-4 +/- (5.04e-4:5.51e-4) rejection probability = 19% (C=95.11; N=102) |
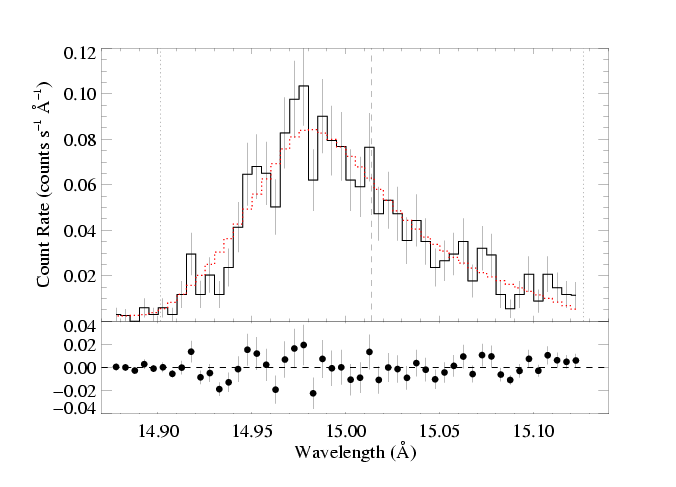
And here's the fit when we allow q to be a free parameter:
|
[14.87:15.13]
vinf=2250 β=1 powerlaw continuum, n=2; norm=1.91e-3 q=-0.09 +/- (-0.21:0.03) hinf=0 taustar=1.86 +/- (1.52:2.26) uo=0.673 +/- (0.617:0.741) norm=5.28e-4 +/- (5.05e-4:5.51e-4) rejection probability = 22% (C=94.54; N=102) |
Note that allowing this additional free parameter only modestly increases the confidence limit range on the other parameters (like taustar, uo, and the normalization). And in this case, the slightly negative value of q, which puts more emission farther from the star and thus would tend to lead to broader lines, leads to larger values of uo which correspond to more emission near the star (compensating, in some sense, for the negative q value).
The value of C is nearly the same for the best-fit model as for the baseline model, where q is held constant (obviously; as the best-fit q is nearly equal to zero -- we will repeat this exercise for other lines, and see if values of q ~ 0 are generally preferred).
Note that the filling factor is assumed to scale as r-q. The emissivity scales as density squared times the filling factor.
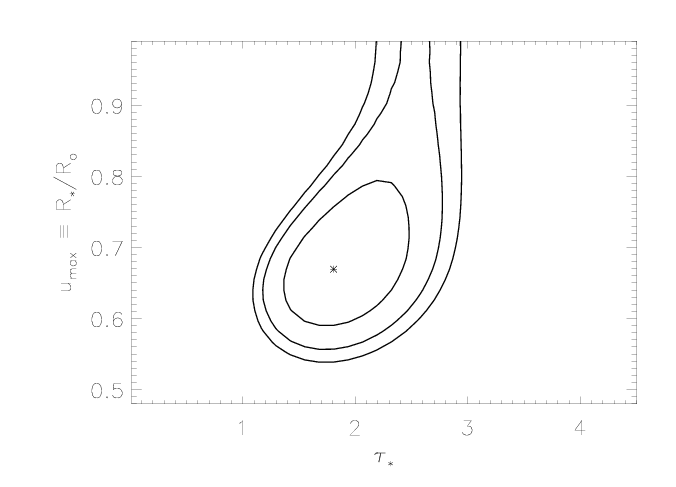
Here are the 68%, 90%, and 95% confidence contours when q is allowed to be a free paramter at each taustar-uo point:
For comparison, here are the confidence contours for the model fit in which the value of q was held fixed at q = 0 (which we've already shown on the page about parameter uncertainty estimation).
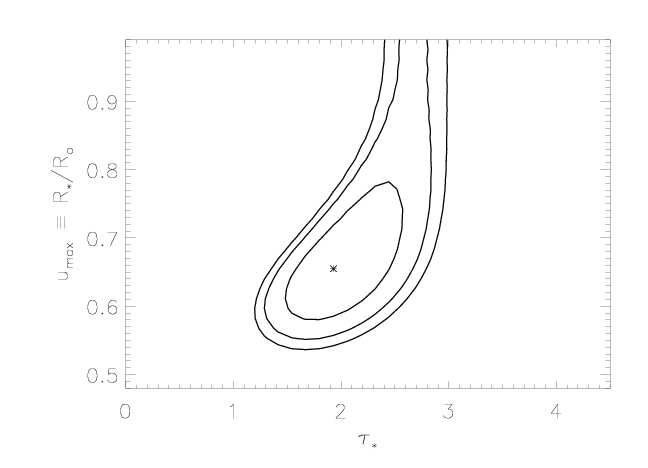
As we've shown above, by looking at the one-dimensional uncertainties, or, more correctly, confidence limits, the confidence regions, like the best-fit model, shifts location a little bit when we allow q to be a free parameter. But the more important effect is that the confidence regions get bigger. This is because at each point in the two-dimensional parameter space we plot here, q is allowed to be a free parameter (in the top plot; it's fixed at zero in the bottom plot). At each point on the grid we plot, q can, in principle, have a different value. We don't show what the value is in these plots, but we could easily include q as one of the dimensions in a similar confidence contour plot.
Conclusions
For this one line, allowing q to be a free parameter has only a small effect on the confidence limits on the more important parameters. To some extent, this is because values near q=0 are preferred.
Back to main page.
last modified: 25 April 2008