Exploring the effects of the wavelength range over which the data are fit
Using the Fe XVII line at 15.014, again
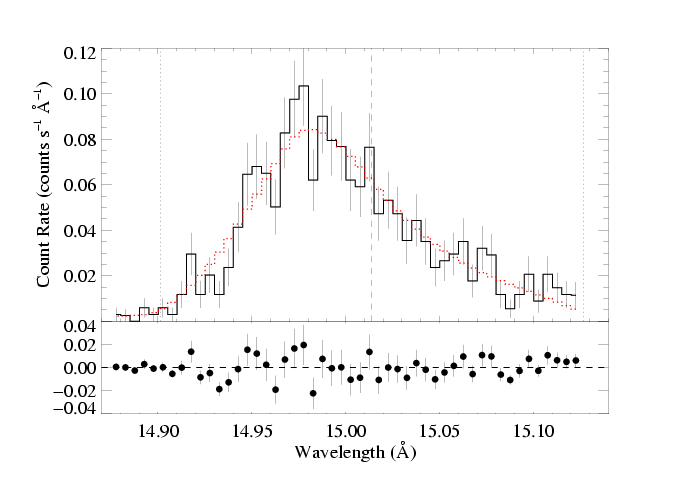
Here is the standard, "baseline," fit to this line, shown on the main page and also on the page exploring the effects of varying the continuum level.
We assume a terminal velocity of 2250 km/s and the "low" continuum level, as can be seen in the listing of model parameters to the right of the data and model fit shown below. The wavelength range for each fit shown below is bold-faced, as are the three fitted parameters (which will/can change from fit to fit, depending on the effects of excluding part of the wavelength range of the line).
|
[14.87:15.13]
vinf=2250 β=1 powerlaw continuum, n=2; norm=1.91e-3 q=0 hinf=0 taustar=1.97 +/- (1.63:2.35) uo=0.655 +/- (0.605:0.725) norm=5.24e-4 +/- (5.04e-4:5.51e-4) rejection probability = 19% |
Note that this fit already includes only a relatively narrow range of data, especially on the red side of the line, where there's contamination of the continuum from a bunch of weak iron lines. But nearly the entire range of the line - from negative to positive vinf - is included, as well as a small amount of the continuum adjacent to the blue wing. (Of course, becasue of the finite spectral resolution, there potentially will be some non-zero contribution from the line emission itself beyond the Doppler shift associated with the wind terminal velocity.)
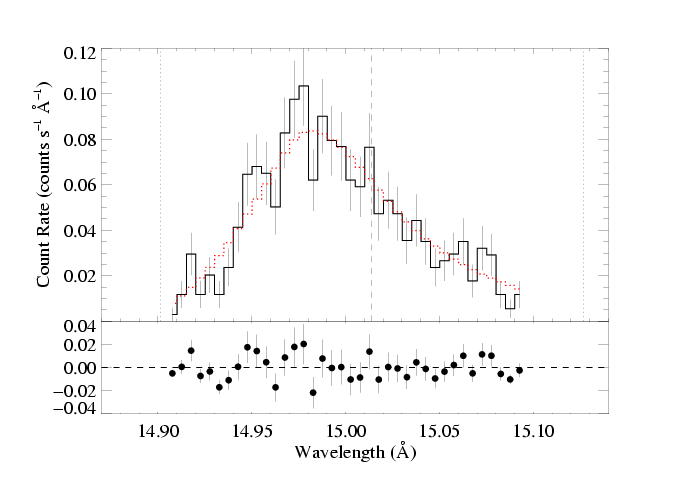
Going to an even narrower range, of [14.90:15.10]:
|
[14.90:15.10]
vinf=2250 β=1 powerlaw continuum, n=2; norm=1.91e-3 q=0 hinf=0 taustar=1.87 +/- (1.55:2.22) uo=0.659 +/- (0.611:0.721) norm=5.20e-4 +/- (4.96e-4:5.42e-4) rejection probability = 32% |
The best-fit parameters hardly change at all, with the fiducial optical depth showing the biggest change, but even that is quite small. The wings of the line carry a fair amount of information, so excluding them from the fit has an effect on the derived model parameters. I would expect the uncertainty range for the model parameters to increase as we throw out data points from our fit. But we don't really see that in the fit above. For this fit on [14.90:15.10] at least, the 68% confidence range on taustar shifts downward a bit; similar to what we saw when we used the higher continuum level.
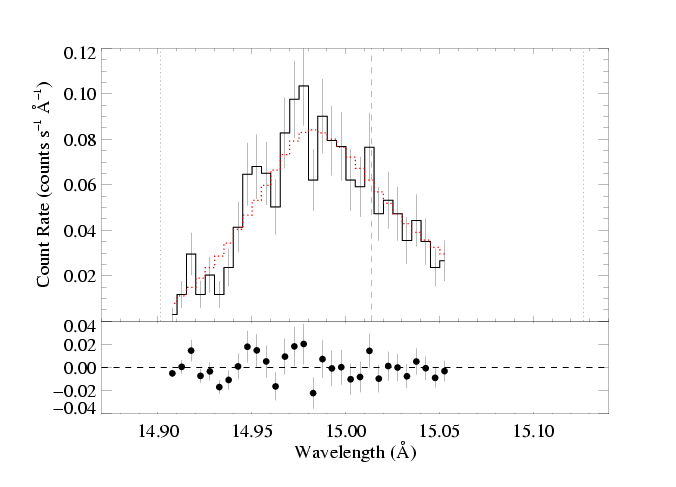
There is an Fe XIX line at 15.079 Angstroms, which might be weakly present in the data. Its peak emissivity is high, but the emissivity peaks at relatively high temperatures (compared to the Fe XVII line at 15.014). Should we exclude much of the red wing of the line from the fit because of this possible contamination? Trying a fit with all bins redward of 15.06 Angstroms excluded:
|
[14.90:15.06]
vinf=2250 β=1 powerlaw continuum, n=2; norm=1.91e-3 q=0 hinf=0 taustar=1.90 +/- (1.58:2.24) uo=0.670 +/- (0.618:0.733) norm=5.16e-4 +/- (4.90e-4:5.39e-4) rejection probability = 7% |
Interestingly, not only don't the best-fit parameters derived from this fit to a restricted portion of the data change much at all, the formal uncertainty ranges are also barely affected.
Conclusions
The derived model paratemeters - and the confidence limits that can be placed on them - are, luckly, not very sensitive to the wavelength range over which the data are fit. This appears to be true even if a significant portion of one line wing is excluded. As is the case with the (lack of) sensitivity to the assumed continuum level, we must evaluate this situation on a case-by-case basis for each line. If there's significant blending for a given line, then whether the contaminated region is included or not could seriously affect the fitted model parameters. However, for a typical line, where mild blending with weak lines is suspected, there appears to be little effect. Similarly, whether the extreme wings, a bit beyond the terminal velocity Doppler shift, are included or excluded from the fit appears to make little difference.
Back to main page.
last modified: 25 April 2008