Fe XVII 17.051, 17.096 Angstroms
Non-porous models
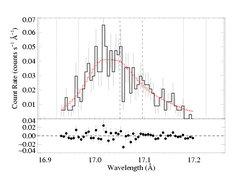
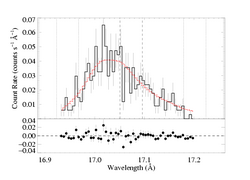
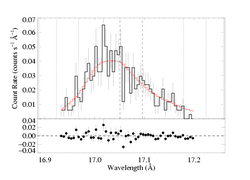
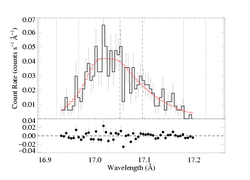
Note: We fit only the MEG data. There are 402 MEG counts in the spectral region we fit (and plot below). See the fitting log.
Continuum fit on 17.2:17.4 (the 16.78 line is in the way on the blue side). View the spectral region near the line: MEG. For n=2, best-fit norm=2.32e-3. The 68% confidence limits on the normalization are +/- 4e-4. And the best fit is formally a good fit.
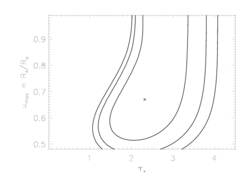
line ratio fixed at 0.8
Here are the 68%, 90%, and 95% joint confidence limits on taustar and uo. The asterisk represents the best-fit model, shown as the red histograms on the above plot.
|
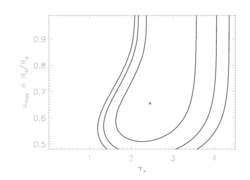
line ratio fixed at 0.9
Here are the 68%, 90%, and 95% joint confidence limits on taustar and uo. The asterisk represents the best-fit model, shown as the red histograms on the above plot.
|
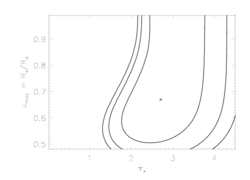
line ratio fixed at 1.0
Here are the 68%, 90%, and 95% joint confidence limits on taustar and uo. The asterisk represents the best-fit model, shown as the red histograms on the above plot.
|
Note that taustar and, especially, uo are not very sensitive to the assumed relative normalizations (line ratio). Even the quality of the fit isn't strongly affected by the value of the relative normalizations, though smaller values are slightly preferred. And as we show below, when this parameter is completely unconstrained, a quite small value - one that isn't plausible given the atomic physics - is preferred, although, again, this preference isn't highly significant.
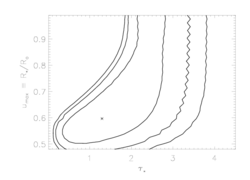
line ratio unconstrained
Here are the 68%, 90%, and 95% joint confidence limits on taustar and uo. The asterisk represents the best-fit model, shown as the red histograms on the above plot.
|
Return to the summary page, where you can link to a representative isoporous fit.
Back to main page.
last modified: 6 July 2008
