Exploring the effects of including HEG data in the fit
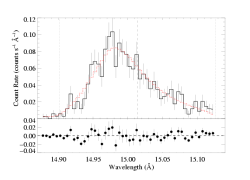
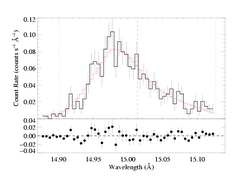
For the purposes of this exercise, we will fit the Fe XVII line at 15.014 over the wavelength range [14.87:15.13] and assume a terminal velocity of 2250 km/s - the baseline model (with the background subtracted).
Here is the baseline model fit (to the MEG data), shown on the main page and other sub-pages.
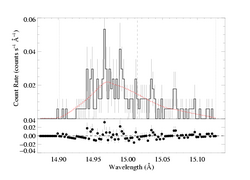
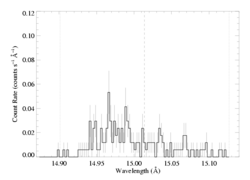
And here's the HEG data (without a model fit) over the same wavelength range:
|
The bins are only half as wide; the resolution is twice as good. But the sensitivity is significantly lower. The y-axis range is the same here as for the MEG plot at the top of the page
And here's the same HEG data with a stretched y-axis, for clarity:
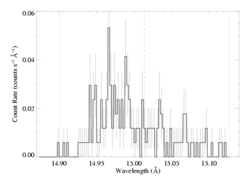
|
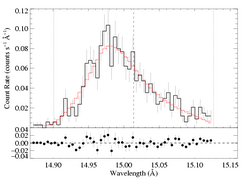
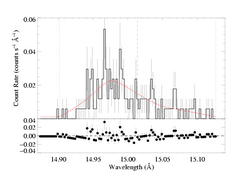
Now we fit the HEG data using the same procedure we used to fit the MEG data (except no background subtraction). The continuum level listed in the fit below was determined by fitting the HEG spectrum just blueward of the line. (The uncertainty range on the continuum level is about a factor of four).
The confidence ranges are wider (significantly, but not hugely). Unfortunately (I think), they're also shifted somewhat. This suggests to me some systematic error in the comparison of the two gratings (e.g. relative calibration error), which might artificially strongly constrain the jointly derived fit parameters. On the other hand, maybe the HEG data really are providing a somewhat different type of information about the line profile shape.
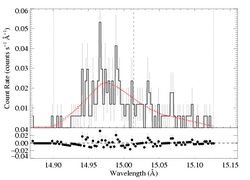
Now fitting both MEG and HEG simultaneously. Neither MEG nor HEG are background subtracted. Note that we determined the continuum level on the same restricted interval (14.85-14.90) that we settled on for the MEG data alone. It gives a relatively low value of 1.71e-3. The 68% confidence limits are 1.16e-3 and 2.39e-3. At the bottom of this page we explore the effects of using a higher continuum level.
In the case of this one particular line, including the HEG along with the MEG in the fitting reduces the confidence ranges of the fit parameters as compared to the MEG-only fits, but not drastically. It - in this case, at least - also affects the upper and lower confidence limits differently; i.e. whole confidence region is shifted over in one direction or the other in parameter space. This could be because the HEG provides information above and beyond what the MEG provides or it could be that we're seeing the results of some kind of systematic calibration error.
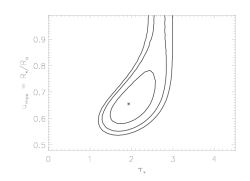
Here are the 68%, 90%, and 95% joint confidence limits on taustar and uo based on fitting the MEG and HEG data together.
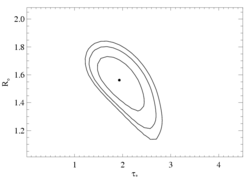
|
Compare this to the larger confidence regions from the fit to the MEG data alone, which we show on the uncertainties page.
In this case, using the HEG data too has the primary effect of ruling out models with uo close to unity (or x-ray emitting plasma very close to the star and moving with low velocities). In some sense the line is broader in the HEG - or models with a lot of emission near line center are less consistent with it.
addendum
Re-fitting MEG and HEG simultaneously, but with a higher continuum level - which was determined from fitting the continuum in both gratings simultaneously, but on a bigger wavelength range - 14.80:14.90 - which (also) yielded a higher continuum level when we fit just the MEG alone on this interval.
And the taustar - uo joint confidence limits:
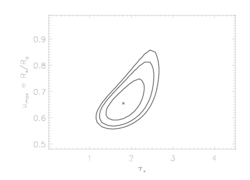
|
The change in the parameter confidence limits with the factor of ~2 increase in the continuum level is small but not completely insignificant. Compare the confidence contours to the plot we showed above, for the lower continuum level:

|
The overall conclusion is that including the HEG data, even when its S/N is significantly lower than that of the MEG, provides additional constraints on our model fitting. It should generally be done if there's significant flux in the HEG data for a given line. And a tentative secondary conclusion is that we may find significantly different continuum levels when we use the HEG data in conjunction with the MEG data for the continuum determination.
Back to main page.
last modified: 25 April 2008
