N VII 24.781 Angstroms
Non-porous models
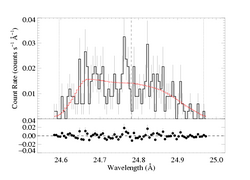
Note: We fit only the MEG data. There are 272 MEG counts in the spectral region we fit (and plot below). See the fitting log.
Continuum fit on 24.40:24.55 and 25.0:25.2. View the spectral region near the line: MEG. For n=2, best-fit norm=2.13e-3. The 68% confidence limits on the normalization are +/- 5e-4. And the best fit is formally a good fit.
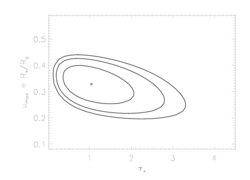
Here are the 68%, 90%, and 95% joint confidence limits on taustar and uo. The asterisk represents the best-fit model, shown as the red histograms on the above plot.
|
Note that the y-axis range is different here than for most other analogous plots for other lines. That's because of the unusually small value of uo that we find for this particular line.
We are concerned about possible line blends, both because of the unusually broad profile in the data, but also because the N VI He-beta (1s3p - 1s^2) line is expected to be present (and strong in the relatively cooler plasma component) at 24.890. We have used APEC to calculate some model spectra in this region. It looks like if there's substantial plasma at 0.1 keV and below, then the intensity of this line could be significant. However, we note that this line would, of course, be Doppler broadened, and thus would have some fraction of its emission at wavelengths longer than 24.89, and there is very little flux observed at those wavelengths.
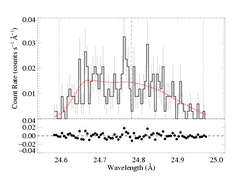
To investigate the effect of contamination by the N VI 3 - 1 line, we fit two wind profile models with parameters tied and normalizations scaled by 0.1 (N VI / N VII), and then 0.2 and 0.4. Here is the 0.1 case:
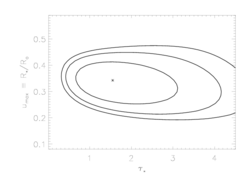
The fit quality is a little worse, but still acceptable. The value of taustar has gone up significantly, but uo is still quite small (it's hardly changed from the single profile model).
Here are the 68%, 90%, and 95% joint confidence limits on taustar and uo. The asterisk represents the best-fit model, shown as the red histograms on the above plot.
|
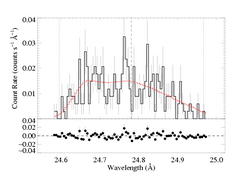
Here is the 0.2 case:
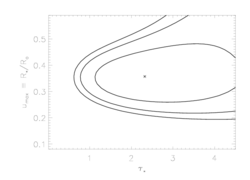
The fit quality is just a little more worse, but still acceptable. The value of taustar has gone up a bit more, but uo is still quite small (the 68% limit still puts Ro above 2 R*).
Here are the 68%, 90%, and 95% joint confidence limits on taustar and uo. The asterisk represents the best-fit model, shown as the red histograms on the above plot.
|
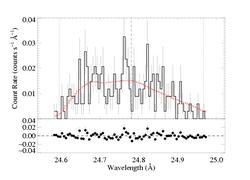
Here is the 0.4 case:
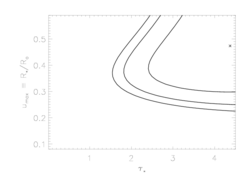
The fit quality is a little worse yet, but still acceptable. The value of taustar has gone up more, but uo is still relatively small.
Here are the 68%, 90%, and 95% joint confidence limits on taustar and uo. The asterisk represents the best-fit model, shown as the red histograms on the above plot.
|
Next, we fit isotropic porosity models to the data. And after that, anisotropic porosity models.
Back to main page.
last modified: 19 June 2008
