Exploring the effects of changing the opacity bridging law
in the Fe XVII 15.014 anisoporous fit
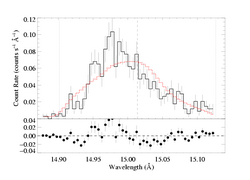
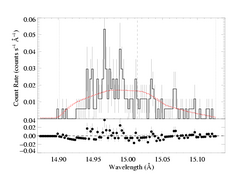
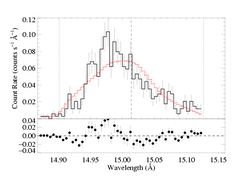
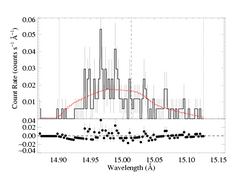
Because the best-fit models with porosity allowed tend to have hinf ~ 0, this comparison is best carried out for a high optical depth, high porosity model. We'll compare the taustar=8 fit, using both the MEG and HEG data.
Here is the default case, using the standard, exponential bridging law, (1 - exp(-tau_c))/tau_c:
And here is the best-fit with parameter 10, Rosseland = 1, which uses the 1/(1 + tau_c) bridging law:
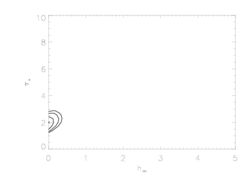
A different comparison of the two bridging laws that we can make involves seeing how the confidence limits around the global best fit change when we look at the two different forms of the bridging law. Below, we show the joint 68%, 90%, and 95% confidence limits on hinf and taustar that we'd calculated previously using the exponential bridging law:
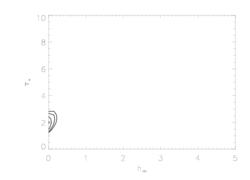
And here is the equivalent plot for the Rosseland bridging law:
There are some differences here. And they make sense in light of the tests shown at the top of the page for the fits with the fixed taustar=8 value. That exercise showed that smaller porosity lengths in the context of the Rosseland bridging law give equivalent profile shapes compared to exponential bridging law models with larger porosity lengths. So it's no surprise that the constraints on the porosity length are tighter about the global best fit models (which have essentially zero porosity) for the Rosseland case.
But the primary conclusion is that we have to be careful in quoting porosity length values for our fits to specify which bridging law was assumed.
Back to main page.
last modified: 28 April 2008
