Exploring the effects of the assumed wind terminal velocity
Using the Fe XVII line at 15.014, again
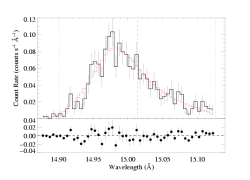
Here is the standard, "baseline," fit to this line, shown on the main page. Note that we assume vinf=2250 km/s which comes from Repolust et al. (2004) and various other Munich-group papers. We hold β=1 for all the fits shown on this page, and use all the "standard" model parameters, including the low continuum level, the "standard" wavelength range ([14.87:15.13]), no radial dependence of the filling factor (q=0), and a non-porous wind (hinf=0) among others. And as we've been doing thus far, we use only the MEG data.
|
[14.87:15.13]
vinf=2250 β=1 powerlaw continuum, n=2; norm=1.91e-3 q=0 hinf=0 taustar=1.97 +/- (1.63:2.35) uo=0.655 +/- (0.605:0.725) norm=5.24e-4 +/- (5.04e-4:5.51e-4) rejection probability = 19% |
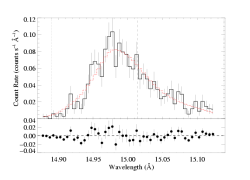
Next, we fit the line with the same model, over the same range of data, with the only change being a higher terminal velocity, of 2485 km/s, which is taken from Howarth & Prinja (1989), and appears to be the highest reliable value in the literature.
|
[14.87:15.13]
vinf=2485 β=1 powerlaw continuum, n=2; norm=1.91e-3 q=0 hinf=0 taustar=1.35 +/- (1.12:1.64) uo=0.668 +/- (0.634:0.713) norm=5.34e-4 +/- (5.08e-4:5.55e-4) rejection probability = 20% |
Most of the fit parameters - including the quality of the fit - don't change significantly at all. The exception is the fiducial optical depth, taustar, which does change significantly. It gets lower as the assumed terminal velocity increases. This is likely due to the fact that the degree of attenuation affects the second moment, the overall shift of the peak of the line. Increasing the terminal velocity makes a specific peak shift in wavelength units appear to be smaller in Doppler velocity units, and this makes the effects of attenuation look less pronounced.
Note that the vertical lines denoting the red- and blue-shifts associated with the terminal velocity are in different locations when we assume a different terminal velocity.
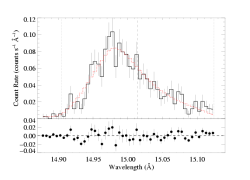
Next we look at a low value of the terminal velocity: 2200 km/s from Groenewegen, Lamers, & Pauldrach (1989).
|
[14.87:15.13]
vinf=2200 β=1 powerlaw continuum, n=2; norm=1.91e-3 q=0 hinf=0 taustar=2.16 +/- (1.78:2.56) uo=0.656 +/- (0.598:0.738) norm=5.24e-4 +/- (5.03e-4:5.50e-4) rejection probability = 21% |
As expected, based on the reasoning about the second moment, this low value of the terminal velocity makes the centroid shift relatively bigger and thus leads to a best-fit model with more attenuation (higher taustar).
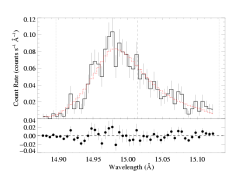
And finally, we look at the value found by Stefan Haser in his thesis - 2350 km/s - using a more relistic model of turbulence, according to Alex.
|
[14.87:15.13]
vinf=2350 β=1 powerlaw continuum, n=2; norm=1.91e-3 q=0 hinf=0 taustar=1.66 +/- (1.38:2.00) uo=0.658 +/- (0.618:0.714) norm=5.31e-4 +/- (5.06e-4:5.52e-4) rejection probability = 18% |
Unsurprisingly, this intermediate value of the terminal velocity gives an intermediate value for the optical depth, taustar.
Conclusions
We find a relatively strong dependence of the fiducial optical depth, taustar, upon our assumed terminal velocity. Changing the terminal velocity by 12% in the case of our baseline Fe XVII line, from 2200 to 2485 km/s, changes taustar by nearly a factor of two: 2.16 to 1.35. The quality of the best-fits does not vary significantly (all give about the same C value).
Note that we have taken β=1 throughout. We could, in principle, relax this assumption and use a non-integer value, but it would require an additional numerical integration in each model calculation within the fitting routine.
Addendum
We have explored the extent to which the data can constrain the derived terminal velocity, by treating the terminal velocity as a free parameter of the fit. You can view the detailed log of the fitting. We have performed this exercise on four of the best lines, with the results summarized below.
| lines | best vinf | 68% conf. range |
| O VIII, 18.97A | 2096 | [1995:2240] |
| Fe XVII, 16.78A | 2372 | [2148:2657] |
| Fe XVII, 15.01A | 2352 | [2258:2531] |
| Ne X, 12.13A | 2375 | [2208:2582] |
| Mg XII, 8.421A | 1725 | [1540:2650] |
Note that the Mg XII terminal velocity is essentially unconstrained. This line is relatively weak, but also less well resolved, due to its shorter wavelength.
In all cases, our adopted value of 2250 is within (or very, very close to) the 68% confidence limits. Some lines prefer slightly higher values, other slightly lower.
Of course, allowing the terminal velocity to be a free parameter has an effect on the other model parameters. We can visualize the effects by examining the confidence limits in taustar, uo parameter space. Below, we show the original confidence regions (for fixed vinf=2250 km/s) on the left, and newly calculated confidence regions (for free vinf) on the right:
O VIII, 18.97A
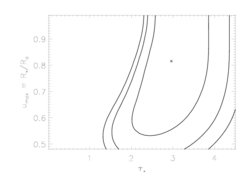
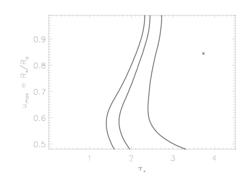
|
Fe XVII, 16.78A
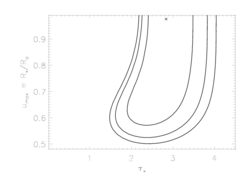
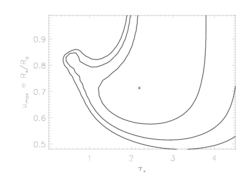
|
Fe XVII, 15.01A
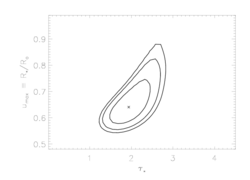
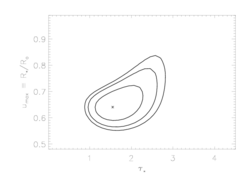
|
Ne X, 12.13A
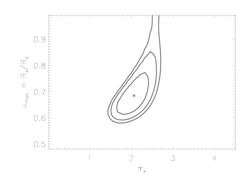
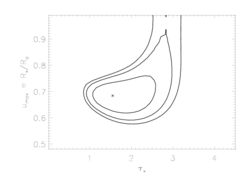
|
So, it looks like the value we've adopted for the terminal velocity is consistent with what the X-ray data are telling us; that taken together, these lines indicate that the terminal velocity can't be that different than 2250 (the oxygen line favors very slightly lower values, the iron line very slightly higher). Furthermore, while allowing the terminal velocity to be a completely free parameter does expand the confidence regions (on taustar and Ro), the effect is not that great.
Back to main page.
last modified: 19 February 2009