ζ Pup: XMM RGS line-profile analysis
The results presented here (April 2012) are getting close to being final. We all met on 26 April at Bartol, and agreed on which data to use for each line and to use no wavelength shift for any line. Previously, we'd extensively documented fits with free shift parameters.
For the time being, we show only the non-porous fits. Soon we'll post the fits with porosity. As of May 8 we've started to post them. They're on separate pages, one for each line, linked from the bottom of each line's section, below.
The data presented here were re-reduced by Maurice (in January 2012), using the latest software and calibration files (SAS v.11). The same as were used in the above-linked fits posted in March.
These data include all GO and GTO observations. The effective exposure times are 846.2 ks for RGS1 and 841.8 ks for RGS2.
Comparisons can be made to these older, and extensive, fits to the Chandra data and also to a corresponding page of Chandra fit results analogous to the RGS fits shown on this page (i.e. also intended for paper II; same focus on porosity, and on high S/N unblended lines).
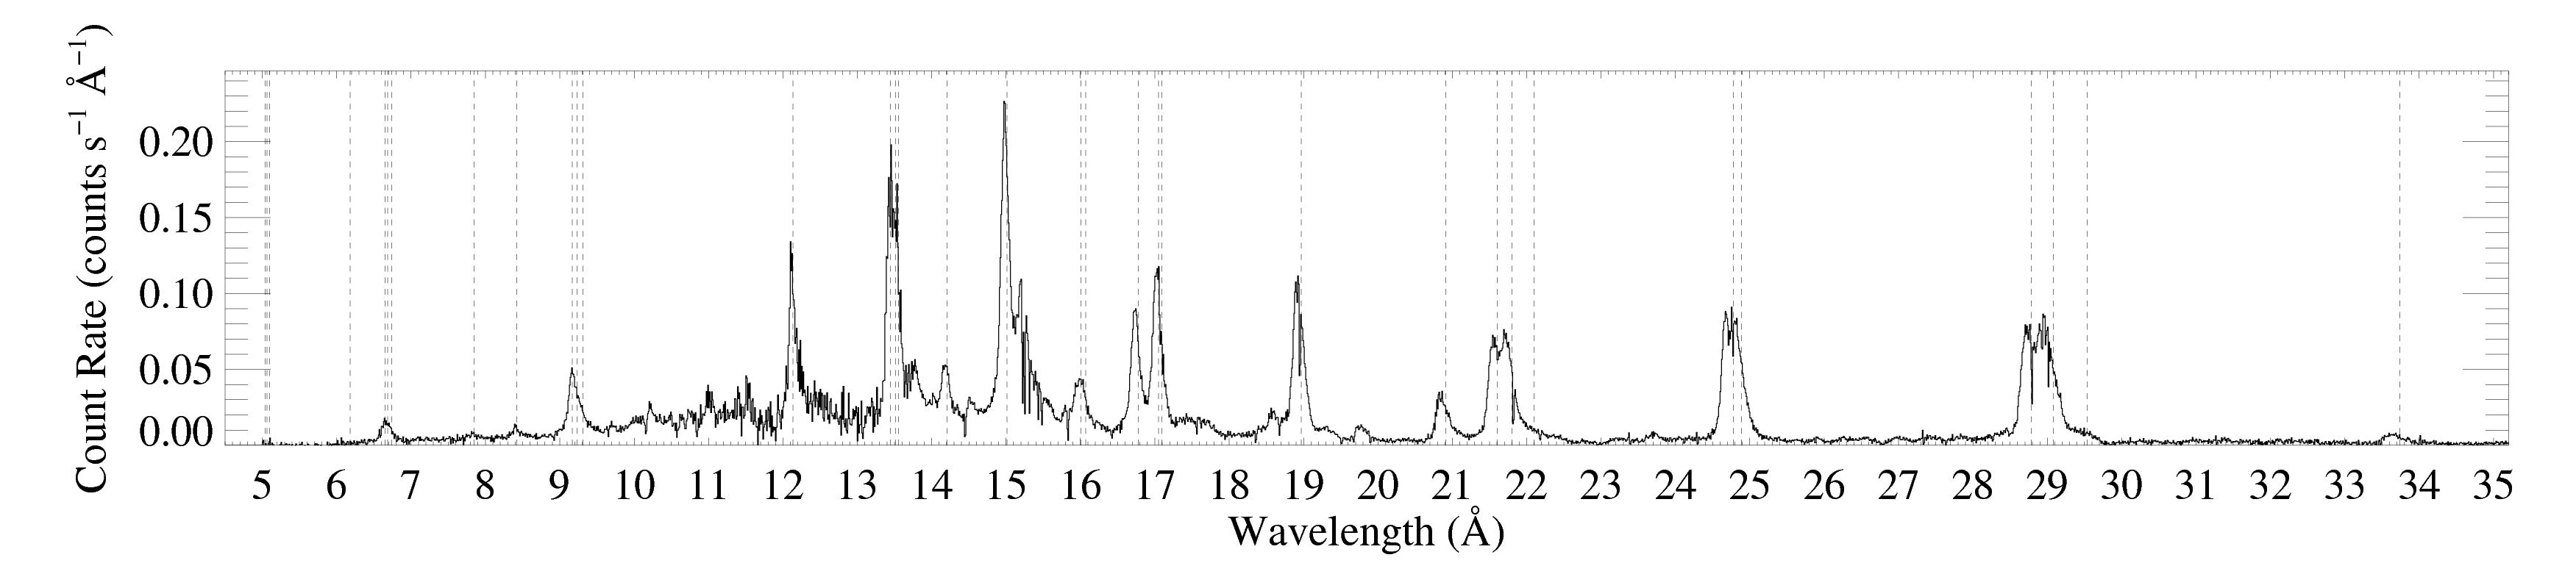
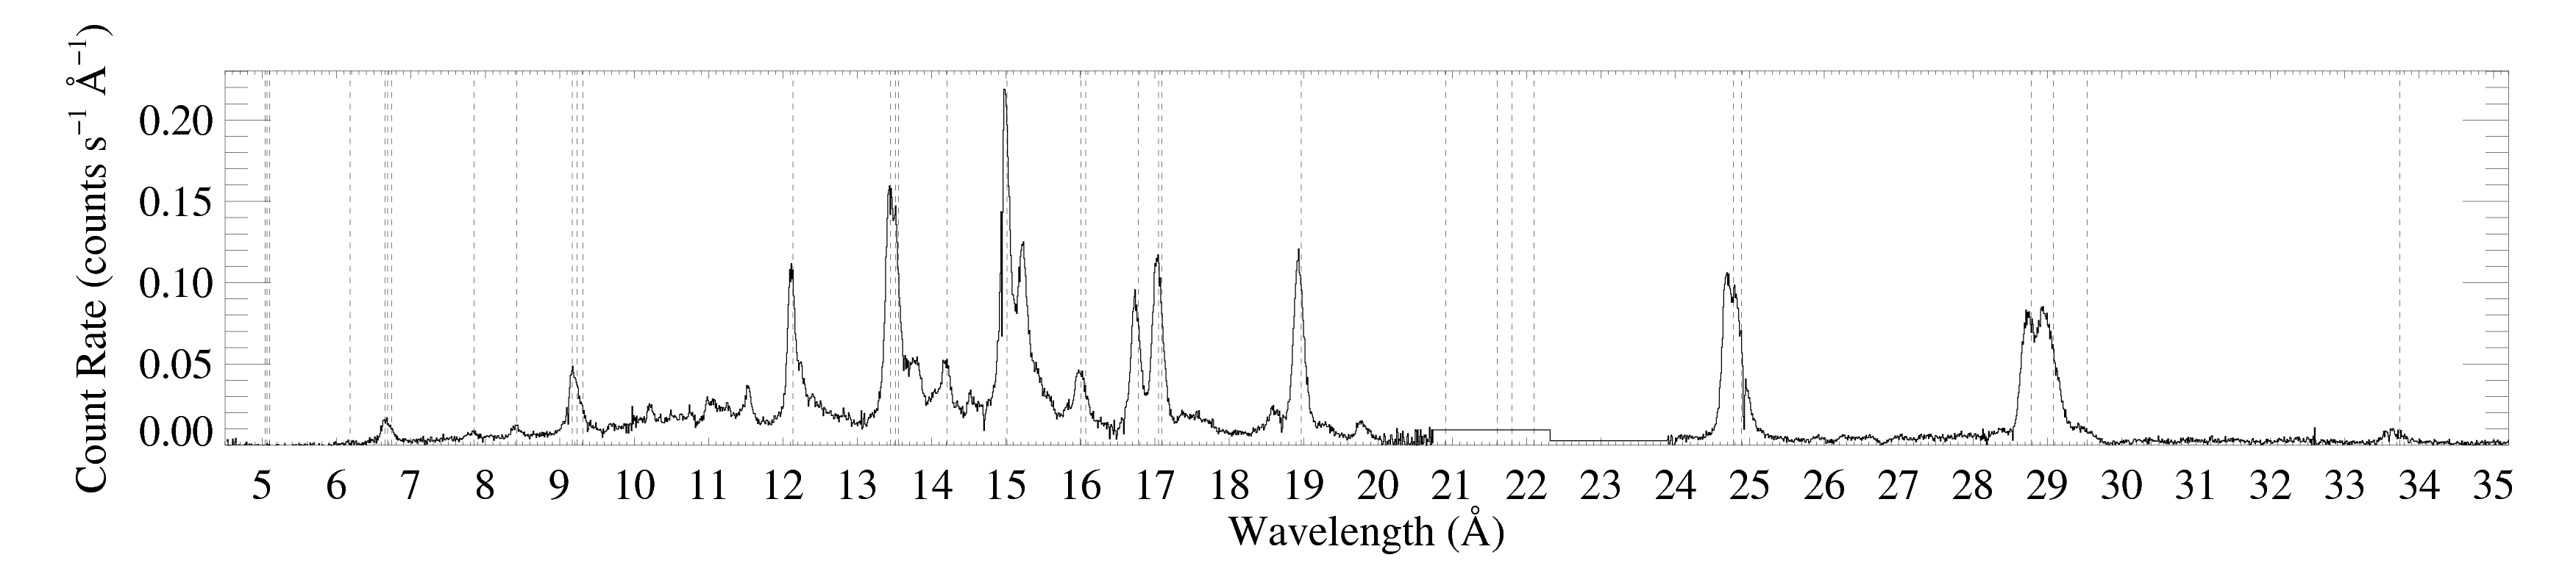
The entire RGS spectrum
RGS1
RGS2
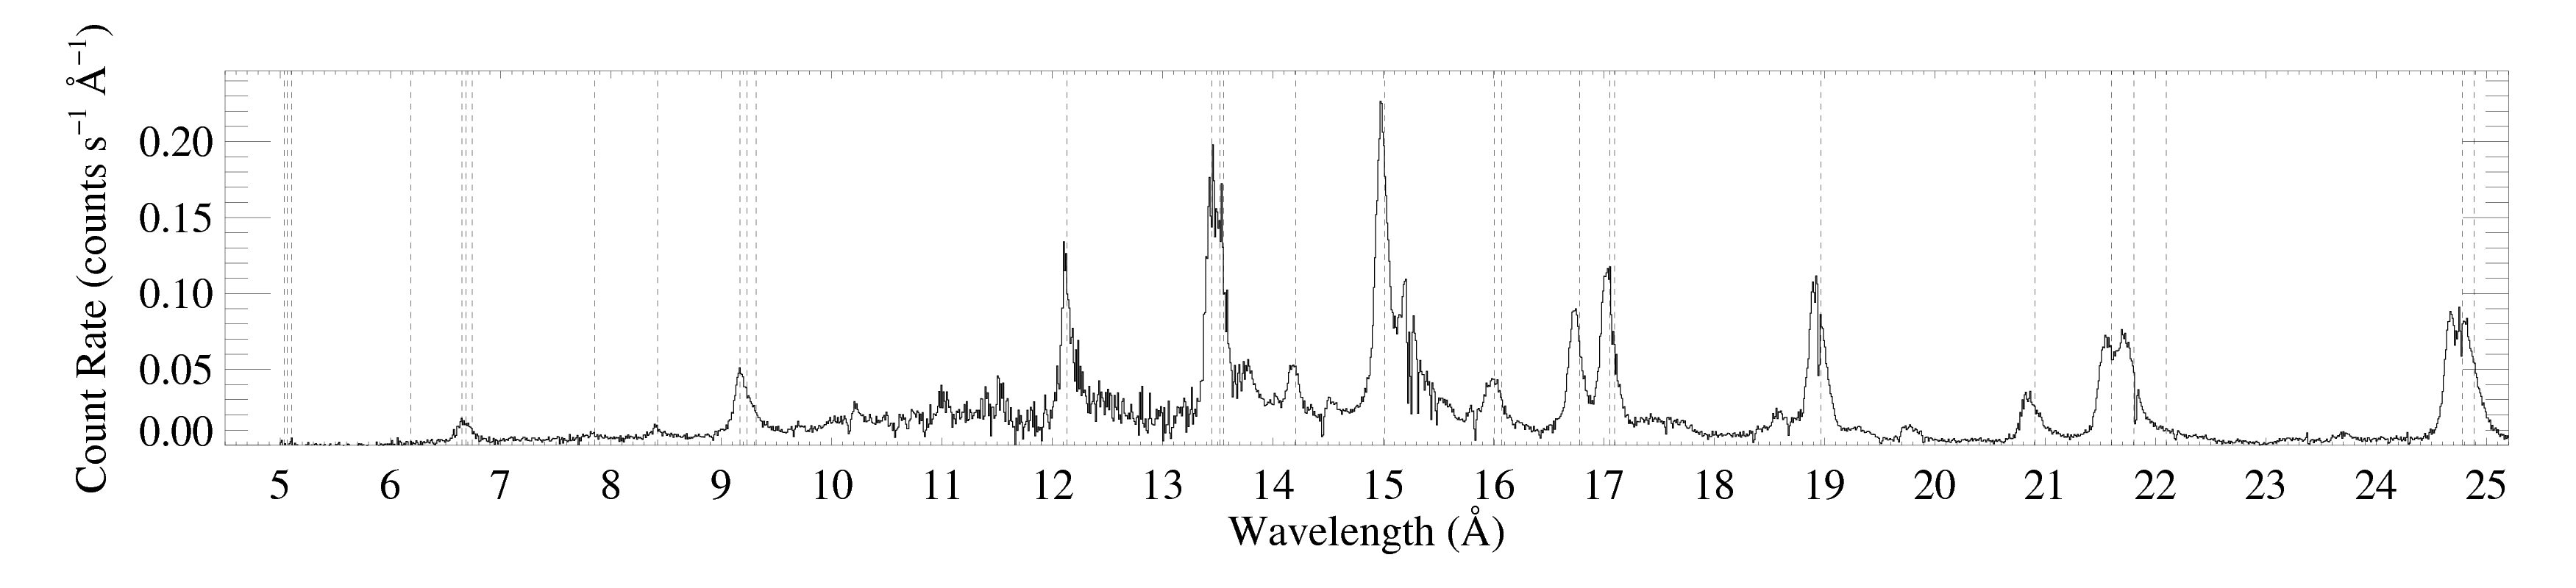
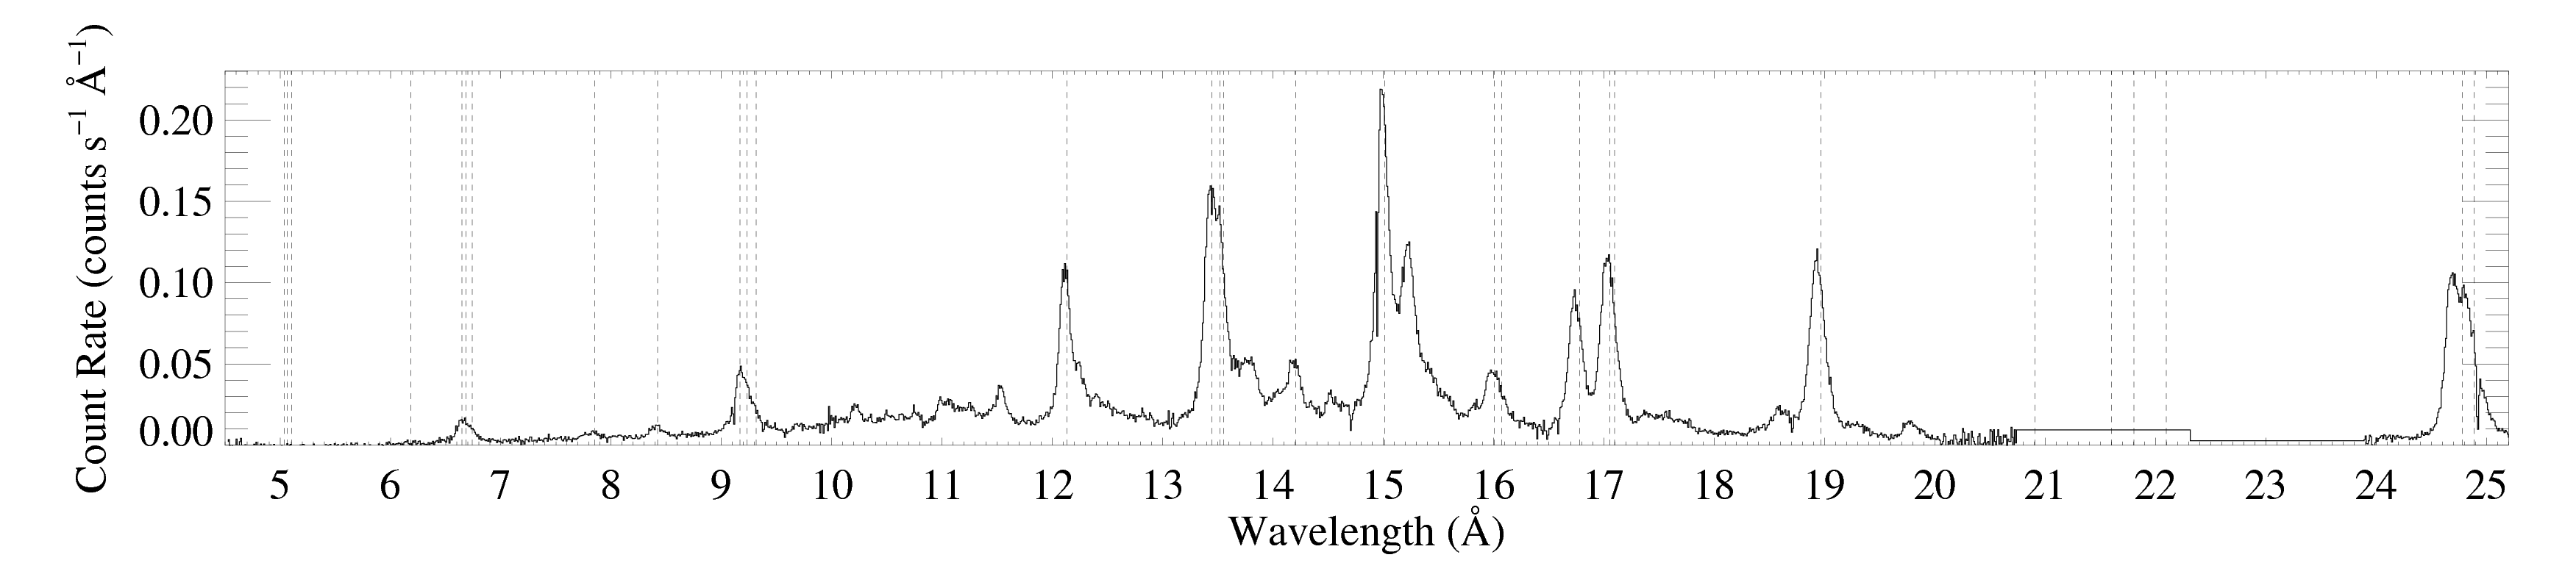
On a somewhat narrower wavelength range, for direct comparison with the Chandra data [RGS1, RGS2]
From working with the previous reduction, we know that there are really only four unblended lines suitable for profile fitting: Ne X Lyα at 12.134 A, Fe XVII at 15.014 A, Fe XVII at 16.780 A, O VIII Lyα at 18.969 A, and N VII Lyβ at 20.910 A.
We fit the power-law continuum simultaneously (unlike with Chandra data) and also use chi-square with Churazov weighting (again, in contrast to our procedures with Chandra data).
Line-by-line results
12.134 Angstroms: Ne X
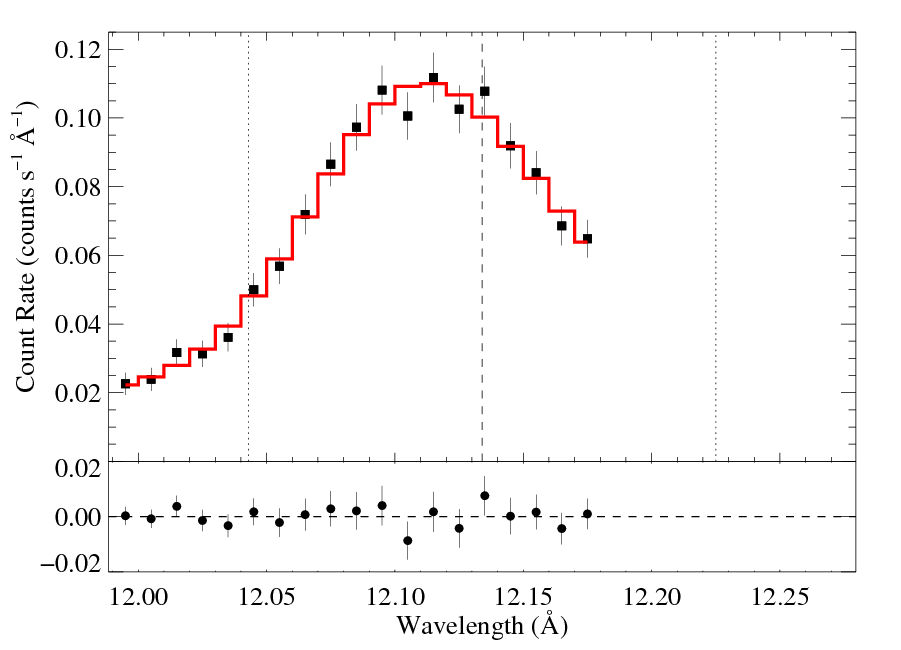
We fit only the RGS2 data (there is very little RGS1 data, due to a camera failure -- the effects of including that additional data are shown in our archive of previous fits).
Non-porous: RGS2
|
[11.98:12.18]
vinf = 2250 β = 1 powerlaw continuum, n = 2 norm = 1.44e-3 +/- (1.14e-3:1.74e-3) q = 0 hinf = 0 taustar = 1.81 +/- (1.59:2.06) Ro = 1.61 +/- (1.43:1.76) shift = 0 norm = 3.10e-4 +/- (3.02e-4:3.18e-4) chisq = 24.04 for N = 19 |
This fit is formally pretty good (chi-sq = 24 for 15 d.o.f).
Compare these results to the analogous model fit to the same line in the Chandra spectrum. There is quite good agreement (taustar values disagree by only about 10%, well within the formal confidence limit range). The same is true for Ro, while the normalizations disagree by about 2-sigma.
Just to demonstrate the sensitivity to the shift parameter, we also present a fit with that parameter free:
Non-porous: RGS2, shift free

|
[11.98:12.18]
vinf = 2250 β = 1 powerlaw continuum, n = 2 norm = 1.41e-3 +/- (1.07e-3:1.72e-3) q = 0 hinf = 0 taustar = 1.05 +/- (0.15:2.94) Ro = 1.69 +/- (1.01:1.80) shift = -3.95 +/- (-13.2:3.83) norm = 3.08e-4 +/- (2.99e-4:3.19e-4) chisq = 23.87 for N = 19 |
A modest, negative shift is preferred, and it leads to a lower taustar value and larger confidence regions. Even this shift, of 4 mA, lowers the best-fit taustar value by almost a factor of two. Something to keep in mind.
New: see the fits with porous models.
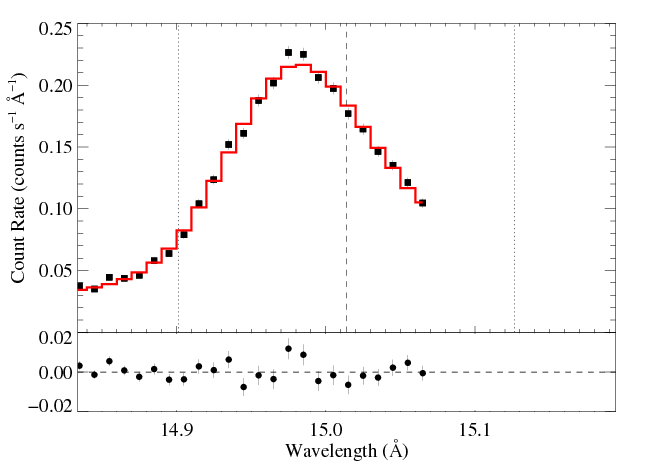
15.014 Angstroms: Fe XVII
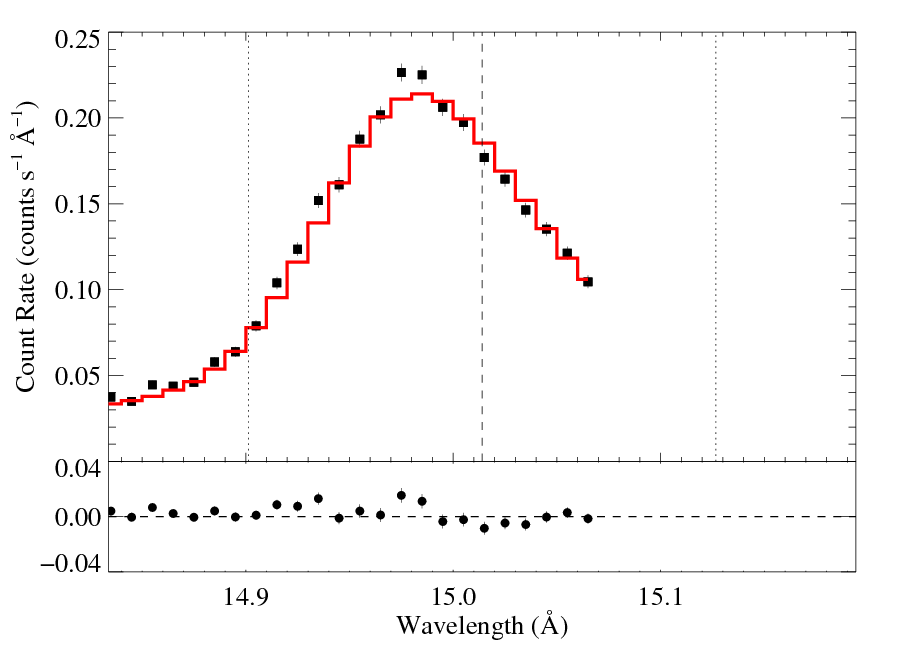
For this line we use both the RGS1 and RGS2 data, and as with the other lines, we do not allow shift to be a free parameter.
Non-porous: RGS1+2
RGS1
RGS2 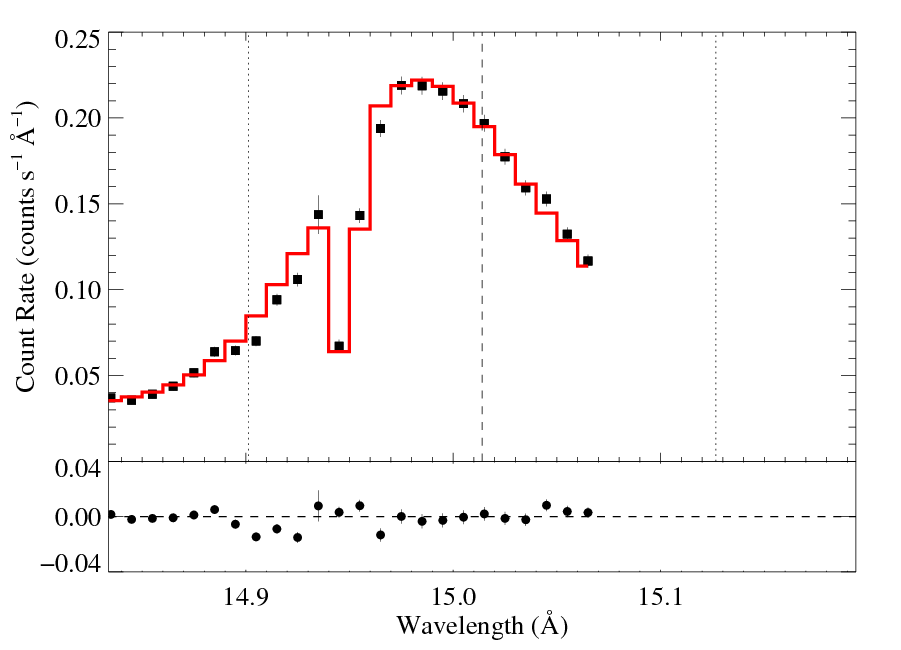
|
[14.80:15.07]
vinf = 2250 β = 1 powerlaw continuum, n = 2 norm = 3.13e-3 +/- (:) q = 0 hinf = 0 taustar = 1.77 +/- (:) Ro = 1.57 +/- (:) shift = 0 norm = 6.39e-4 +/- (:) chisq = 129.54 for N = 52 |
We show the two spectra separately, but they were fit simultaneously. That's the same model in both plots.
Note: Because the reduced chi square of this fit is >2, XSPEC won't compute the confidence limits on the model parameters. The chi square of the best fit model is high most likely because the formal error bars are so low, while the actual errors are probably dominated by systematics (which, of course, aren't included in the error bars).
Note: The low bin on the blue wing is due to the low sensitivity of a particular detector pixel, and is thought to be well calibrated. We repeated this fit with the bin eliminated and got a very similar fit, with a very similar fit quality.
Compare the results of this fit to those derived from the same line in the Chandra spectrum. The results are quite consistent.
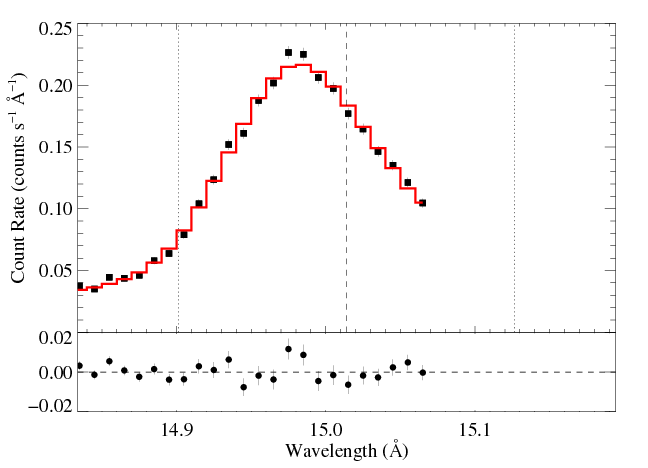
Note that if we fit only the RGS1 data, we get a formally good fit with model parameters that are not hugely different (taustar is higher by 25 percent; these two results straddle the Chandra taustar value). Furthermore, for that fit, if we allow shift to be a free parameter, we find a best-fit value very close to zero. Both these fits are shown below.
Non-porous: RGS1, no shift
|
[14.80:15.07]
vinf = 2250 β = 1 powerlaw continuum, n = 2 norm = 3.19e-3 +/- (3.02e-3:3.32e-3) q = 0 hinf = 0 taustar = 2.30 +/- (2.14:2.50) Ro = 1.42 +/- (1.26:1.53) shift = 0 norm = 6.48e-4 +/- (6.41e-4:6.56e-4) chisq = 33.09 for N = 26 |
Non-porous: RGS1, shift free
|
[14.80:15.07]
vinf = 2250 β = 1 powerlaw continuum, n = 2 norm = 3.18e-3 +/- (2.96e-3:3.40e-3) q = 0 hinf = 0 taustar = 2.38 +/- (1.87:2.74) Ro = 1.39 +/- (1.18:1.55) shift = 0.32 +/- (-1.82:1.78) norm = 6.49e-4 +/- (6.41e-4:6.58e-4) chisq = 33.05 for N = 26 |
These two fits are just for demonstration purposes. We don't have any justification for excluding the RGS2 data, and we decided to freeze shift at zero in any case. (And on the page of older fits you can see a good fit in which both shift parameters are allowed to be free, independent of each other.)
New: see the fits with porous models.
16.780 Angstroms: Fe XVII
For this line we use both the RGS1 and RGS2 data, and as with the other lines, we do not allow shift to be a free parameter. There is mild blending with the blue wing of the 17.05/17.10 complex. We eliminate a large portion of the red wing of the 16.780 line from the fit, and also include a model component for the line near 17 A (although with the red wing eliminated from the fit, the inclusion of the 17A model does not make a difference at all).
Non-porous: RGS1+2
RGS1

RGS2 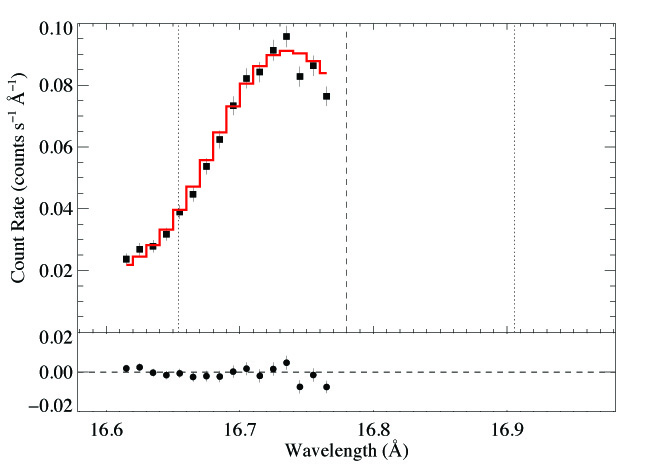
|
[16.60:16.77]
vinf = 2250 β = 1 powerlaw continuum, n = 2 norm = 2.19e-3 +/- (:) q = 0 hinf = 0 taustar = 3.38 +/- (2.93:3.69) Ro = 1.54 +/- (1.15:1.87) shift = 0 norm = 3.01e-4 +/- (2.95e-4:3.08e-4) chisq = 30.34 for N = 32 |
We show the two spectra separately, but they were fit simultaneously. That's the same model in both plots.
Note that we have in fact eliminated a large portion of the line from the fit, due to blending with the blue wing of the 17.05, 17.10 complex. We provide some details of our fitting of the entire complex and our decision to eliminate the red wing of 16.78.
You can compare these results to the same sort of model fit to the Chandra spectrum. The results are consistent.
New: see the fits with porous models.
18.969 Angstroms: O VIII
Here we also fit both datasets and with no imposed wavelength shift.
Non-porous: RGS1+2
RGS1
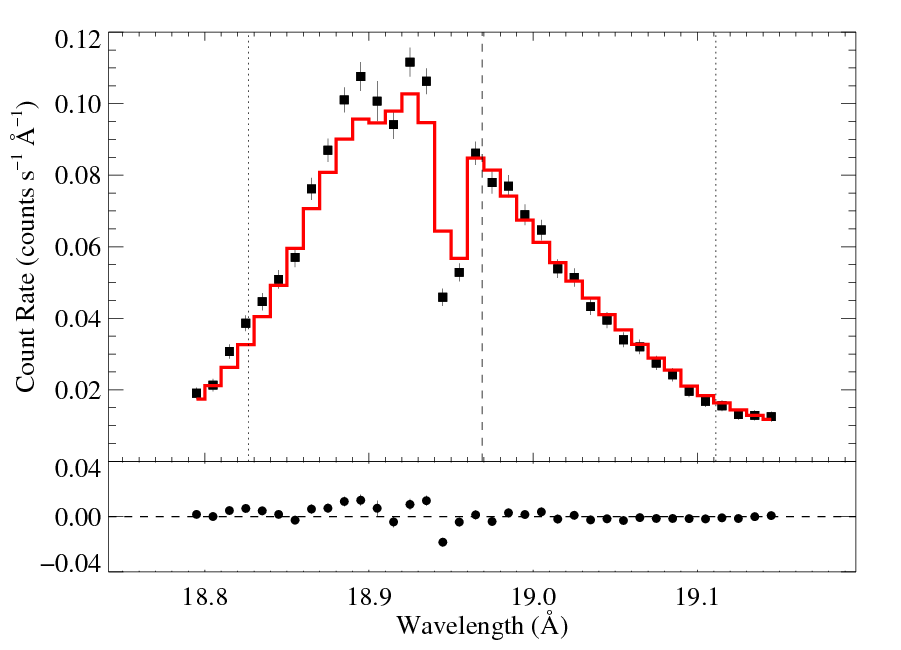
RGS2 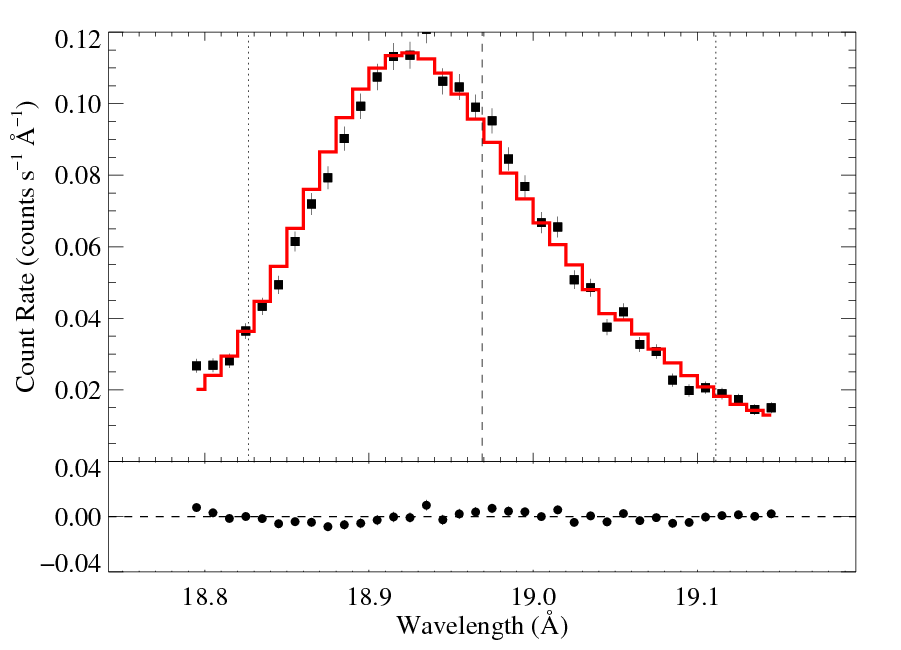
|
[18.78:19.15]
vinf = 2250 β = 1 powerlaw continuum, n = 2 norm = 9.77e-4 +/- (:) q = 0 hinf = 0 taustar = 3.14 +/- (:) Ro = 1.01 +/- (:) shift = 0 norm = 4.66e-4 +/- (:) chisq = 204.34 for N = 72 |
This fit is quite poor, again, with systematic errors likely dominating. And it looks like there are systematic shifts between the two datasets. We explored this in the previous set of fits. Summarizing those experiments, fitting only the RGS2 data yields a formally acceptable fit, with a somewhat lower taustar.
You can compare these results to the same sort of model fit to the Chandra spectrum. The results are similar.
New: see the fits with porous models.
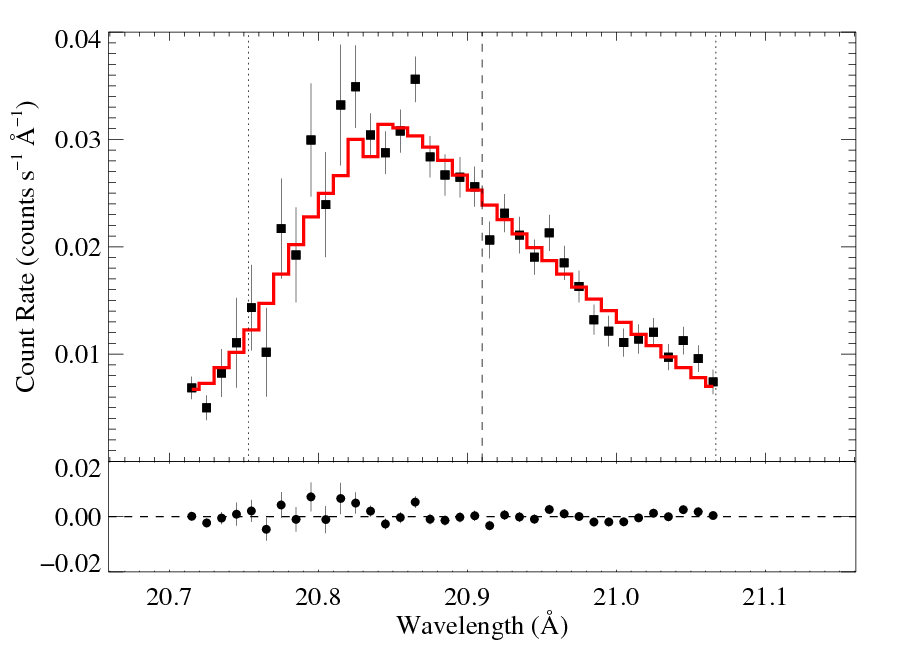
20.910 Angstroms: N VII
There is almost no RGS2 data for this line, so we will look only at RGS1 data.
Non-porous: RGS1
|
[20.70:21.07]
vinf = 2250 β = 1 powerlaw continuum, n = 2 norm = 9.05e-4 +/- (7.33e-4:1.13e-3) q = 0 hinf = 0 taustar = 4.93 +/- (3.90:5.59) Ro = 1.41 +/- (1.01:2.03) shift = 0 norm = 1.66e-4 +/- (1.56e-4:1.73e-3) chisq = 40.52 for N = 36 |
The fit is quite good (though mostly, I assume, because these data are relatively low S/N). The taustar value is high, as would be expected.
New: see the fits with porous models.
last modified: 18 May 2012