Exploring the effects of including HEG data in the fit
Isoporosity
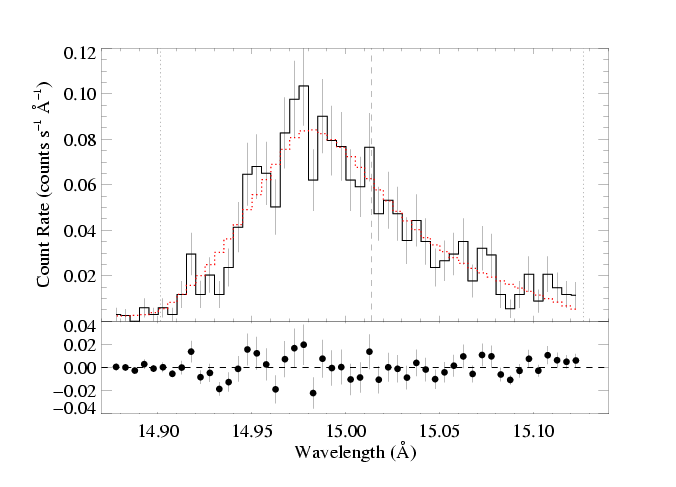
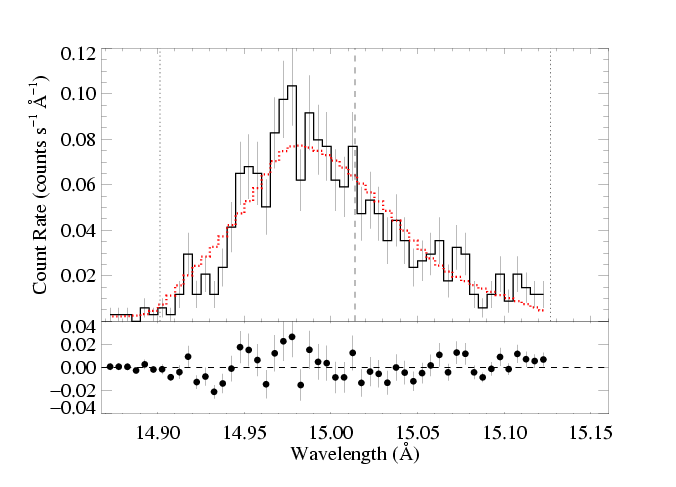
Here is the best-fit isoporous model, fit to only the MEG data in the 15.014 Angstrom line (shown and described in detail elsewhere on this site).
|
[14.87:15.13]
vinf=2250 β=1 powerlaw continuum, n=2; norm=1.91e-3 q=0 hinf=0.00 +/- (0.00:0.66) and for 90% confidence, (0.00:1.49) taustar=1.97 +/- (1.65:2.54) uo=0.655 +/- (0.605:0.720) norm=5.27e-4 +/- (5.04e-4:5.50e-4) rejection probability = 23% (C=95.09; N=102) |
Recall/note that this is quite similar to the baseline model (without porosity), since the best-fit value of the porosity length, hinf = 0.
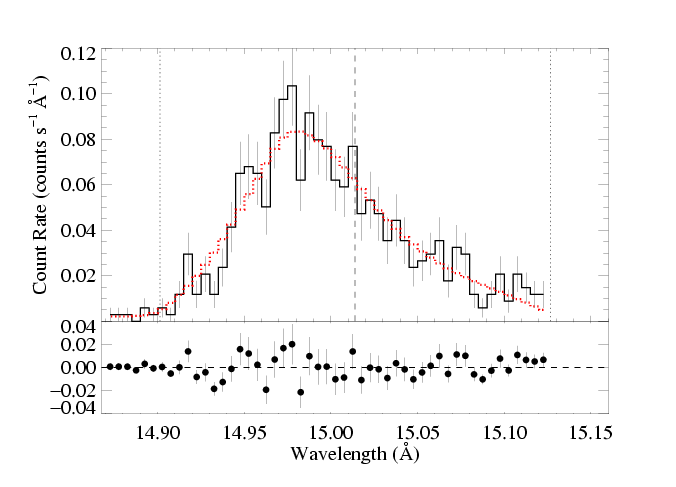
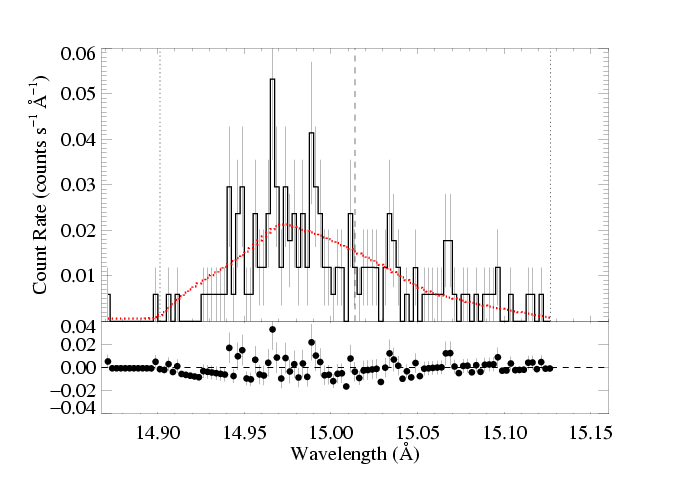
Here is the best-fit isoporous model, fit to the MEG and HEG data simultaneously:
|
[14.87:15.13]
vinf=2250 β=1 powerlaw continuum, n=2; norm=1.71e-3 q=0 hinf=0.00 +/- (0.00:0.43) and for 90% confidence, (0.00:1.07) taustar=1.94 +/- (1.63:2.29) uo=0.646 +/- (0.597:0.700) norm=5.30e-4 +/- (5.07e-4:5.49e-4) rejection probability = 27% (C=280.82; N=308) |
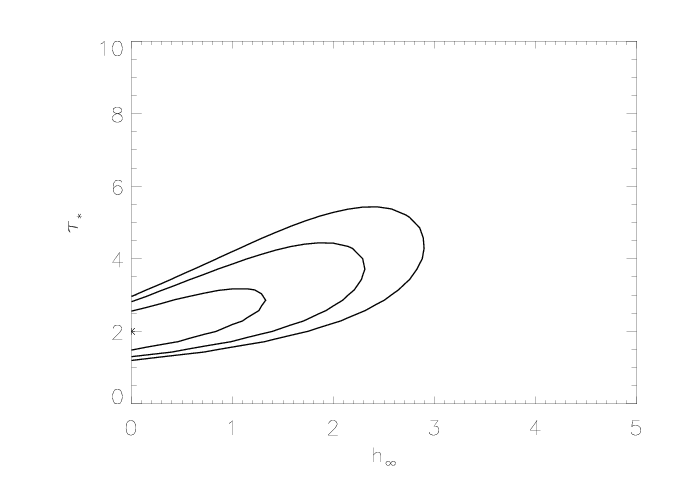
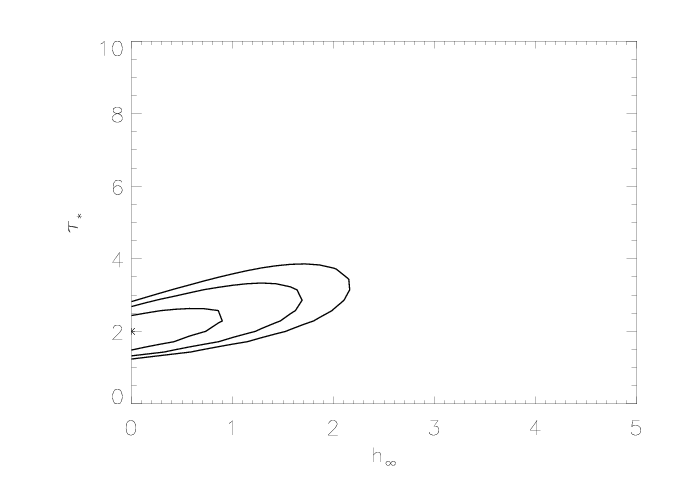
Here are the joint constraints on taustar and hinf. The constraints derived from the MEG data alone are on the left (this is also shown on the isoporosity subpage). The tighter constraints derived from the combined MEG and HEG data are on the right.
Here are the joint constraints on taustar and uo, again with MEG only on the left and MEG and HEG combined on the right:
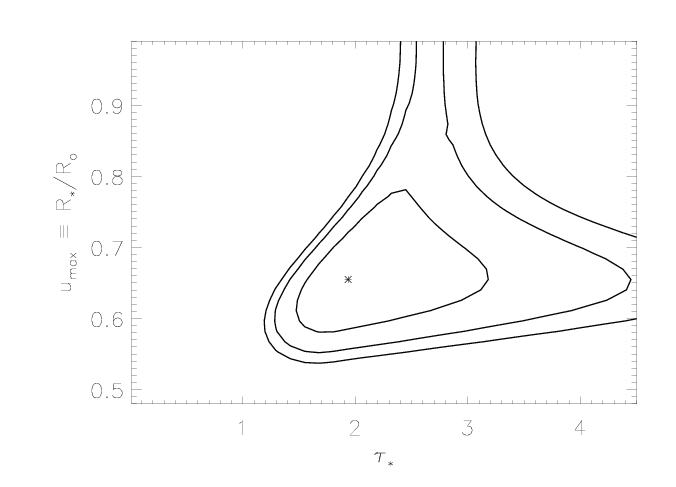

The additional constraints provided by the inclusion of the HEG data are not insignificant in the case of this line.
We will now repeat the exercise investigating the extent to which porosity can explain the profile shape in the context of higher mass-loss rates. Specifically, if the literature mass-loss rate is correct, then (a) can porosity explain the relatively symmetric profile (as well as a reduction in mass-loss rate in the context of a non-porous wind can) and (b) what levels of porosity (what values of hinf) are required? We already performed this exercise for the MEG data alone.
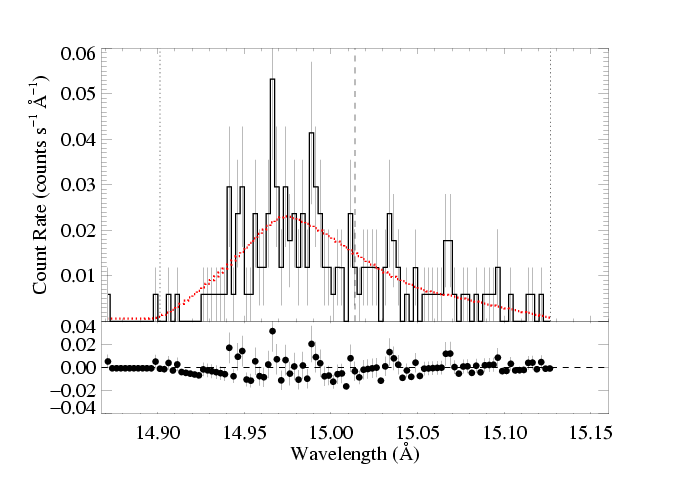
Here is the best-fit isoporous model with taustar=8 fixed, fit simultaneously to the MEG and HEG data:
|
[14.87:15.13]
vinf=2250 β=1 powerlaw continuum, n=2; norm=1.71e-3 q=0 hinf=3.64 +/- (2.89:4.51) and for 90% confidence, (2.51:5.21) taustar=8 uo=0.623 +/- (0.591:0.661) norm=5.25e-4 +/- (5.07e-4:5.49e-4) rejection probability = 50% (C=295.74; N=308) |
Note that the value of the fit statistic, C=295.74, is ~15 higher than the best-fit value, which implies that the best-fit model (with taustar free) is preferred at >99.9% confidence. As with the fit to the MEG data alone, the porous model with high optical depth leads to a profile with a bulge on the far blue wing and also one near line center. However, this model with taustar=8 and non-zero hinf cannot be rejected outright as a bad fit.
Finally, note that the inclusion of the HEG data does not lead to significantly tighter constraints on hinf in this case where taustar is frozen at a value of 8, although it shifts the confidence region (and best-fit model) toward somewhat higher values of hinf. And, as we show at the top of this page, it does tighten the constraints on taustar and uo.
As with the non-porous model, our overall conclusion here is that the HEG data should be included in the modeling. It does have an effect on the derived model parameters and their confidence limits, even if its S/N is several times lower than that of the MEG data.
Back to main page.
last modified: 25 April 2008