DoAr 21: Chandra Analysis
Here we present our basic analysis results from analyzing and modeling the 94 ks Chandra HETGS observation of the PMS star DoAr 21.
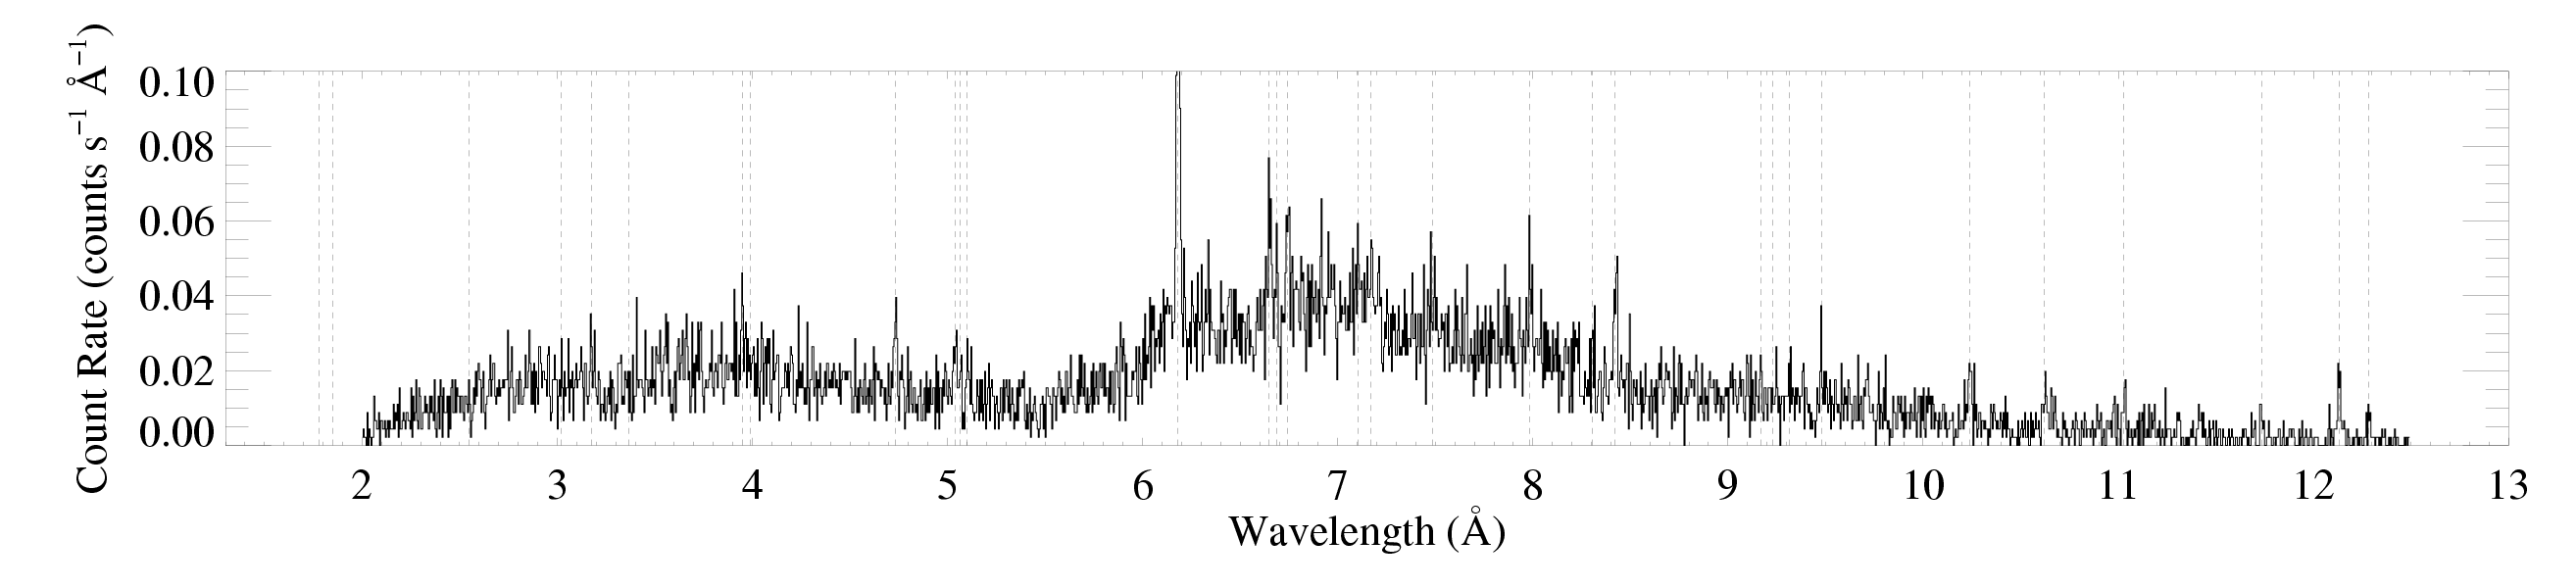
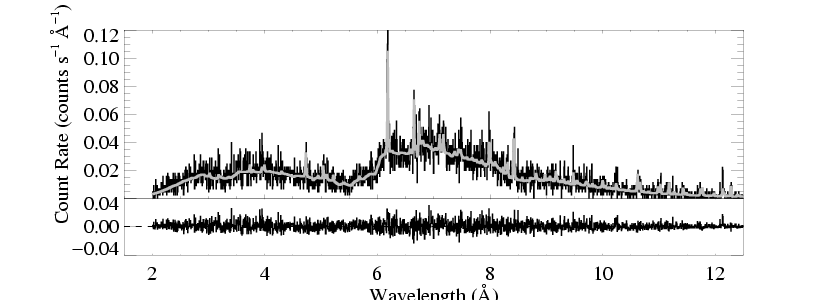
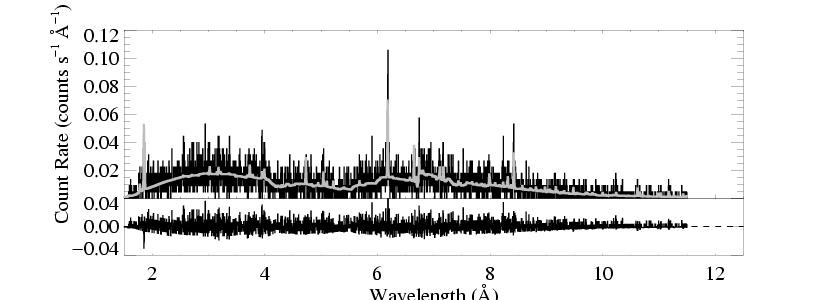
The HETGS spectra
MEG
HEG
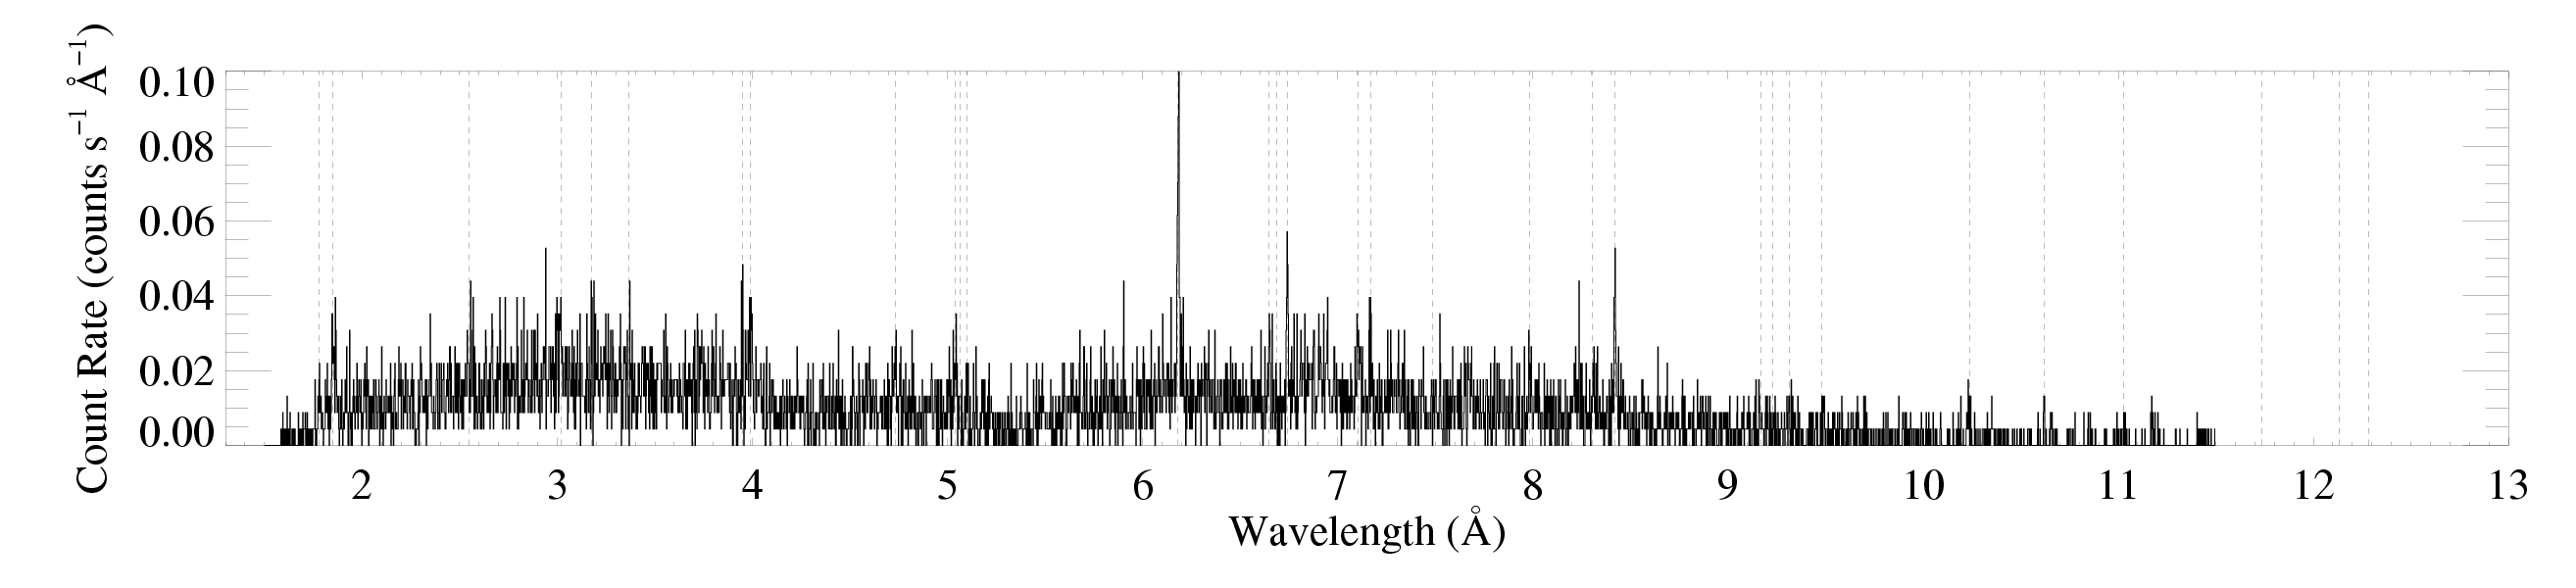
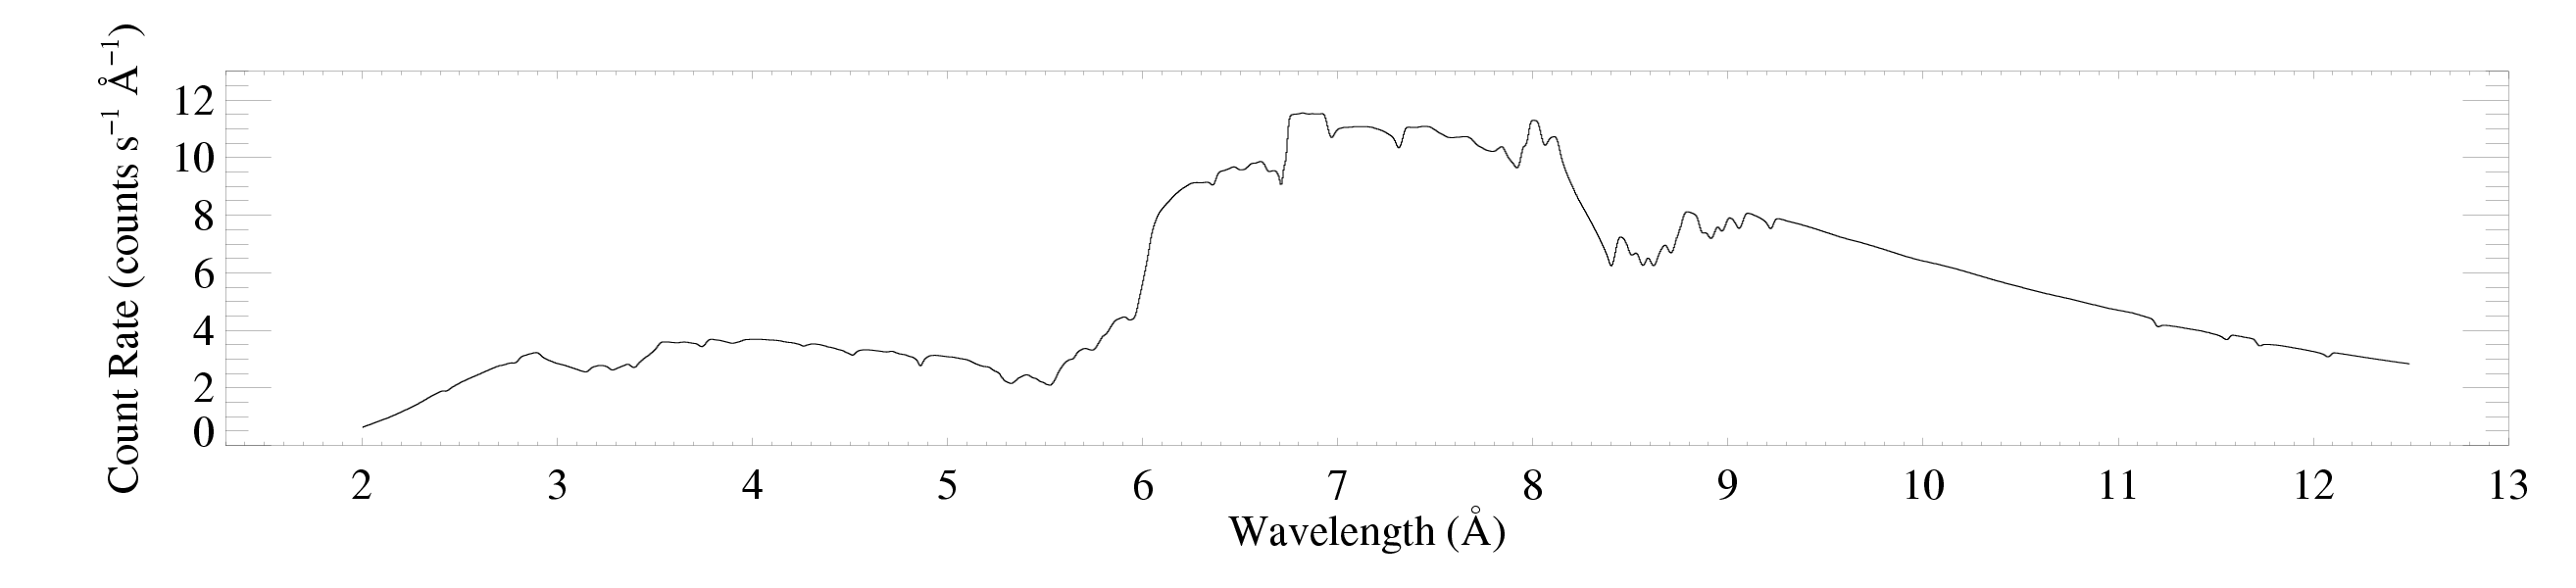
There is also an annotated plot with line identifications. Note that the shape of the continuum is largely determined by the wavelength-dependent effective areas: MEG and HEG. The effective exposure time is 91.0 ks.
Analysis of line strengths and ratios
We fit the H-like Lyα and He-like emission lines of S and Si, and derive the line flux ratios of the pairs of lines from adjacent ionization states of the same element. We also look at the H-like and He-like iron lines and model the f/i ratios in this section.
Global fits to the entire spectrum
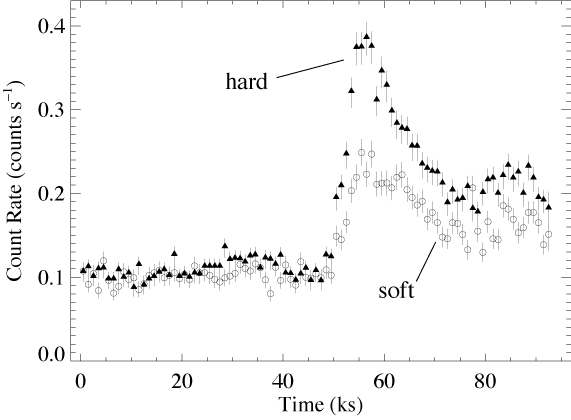
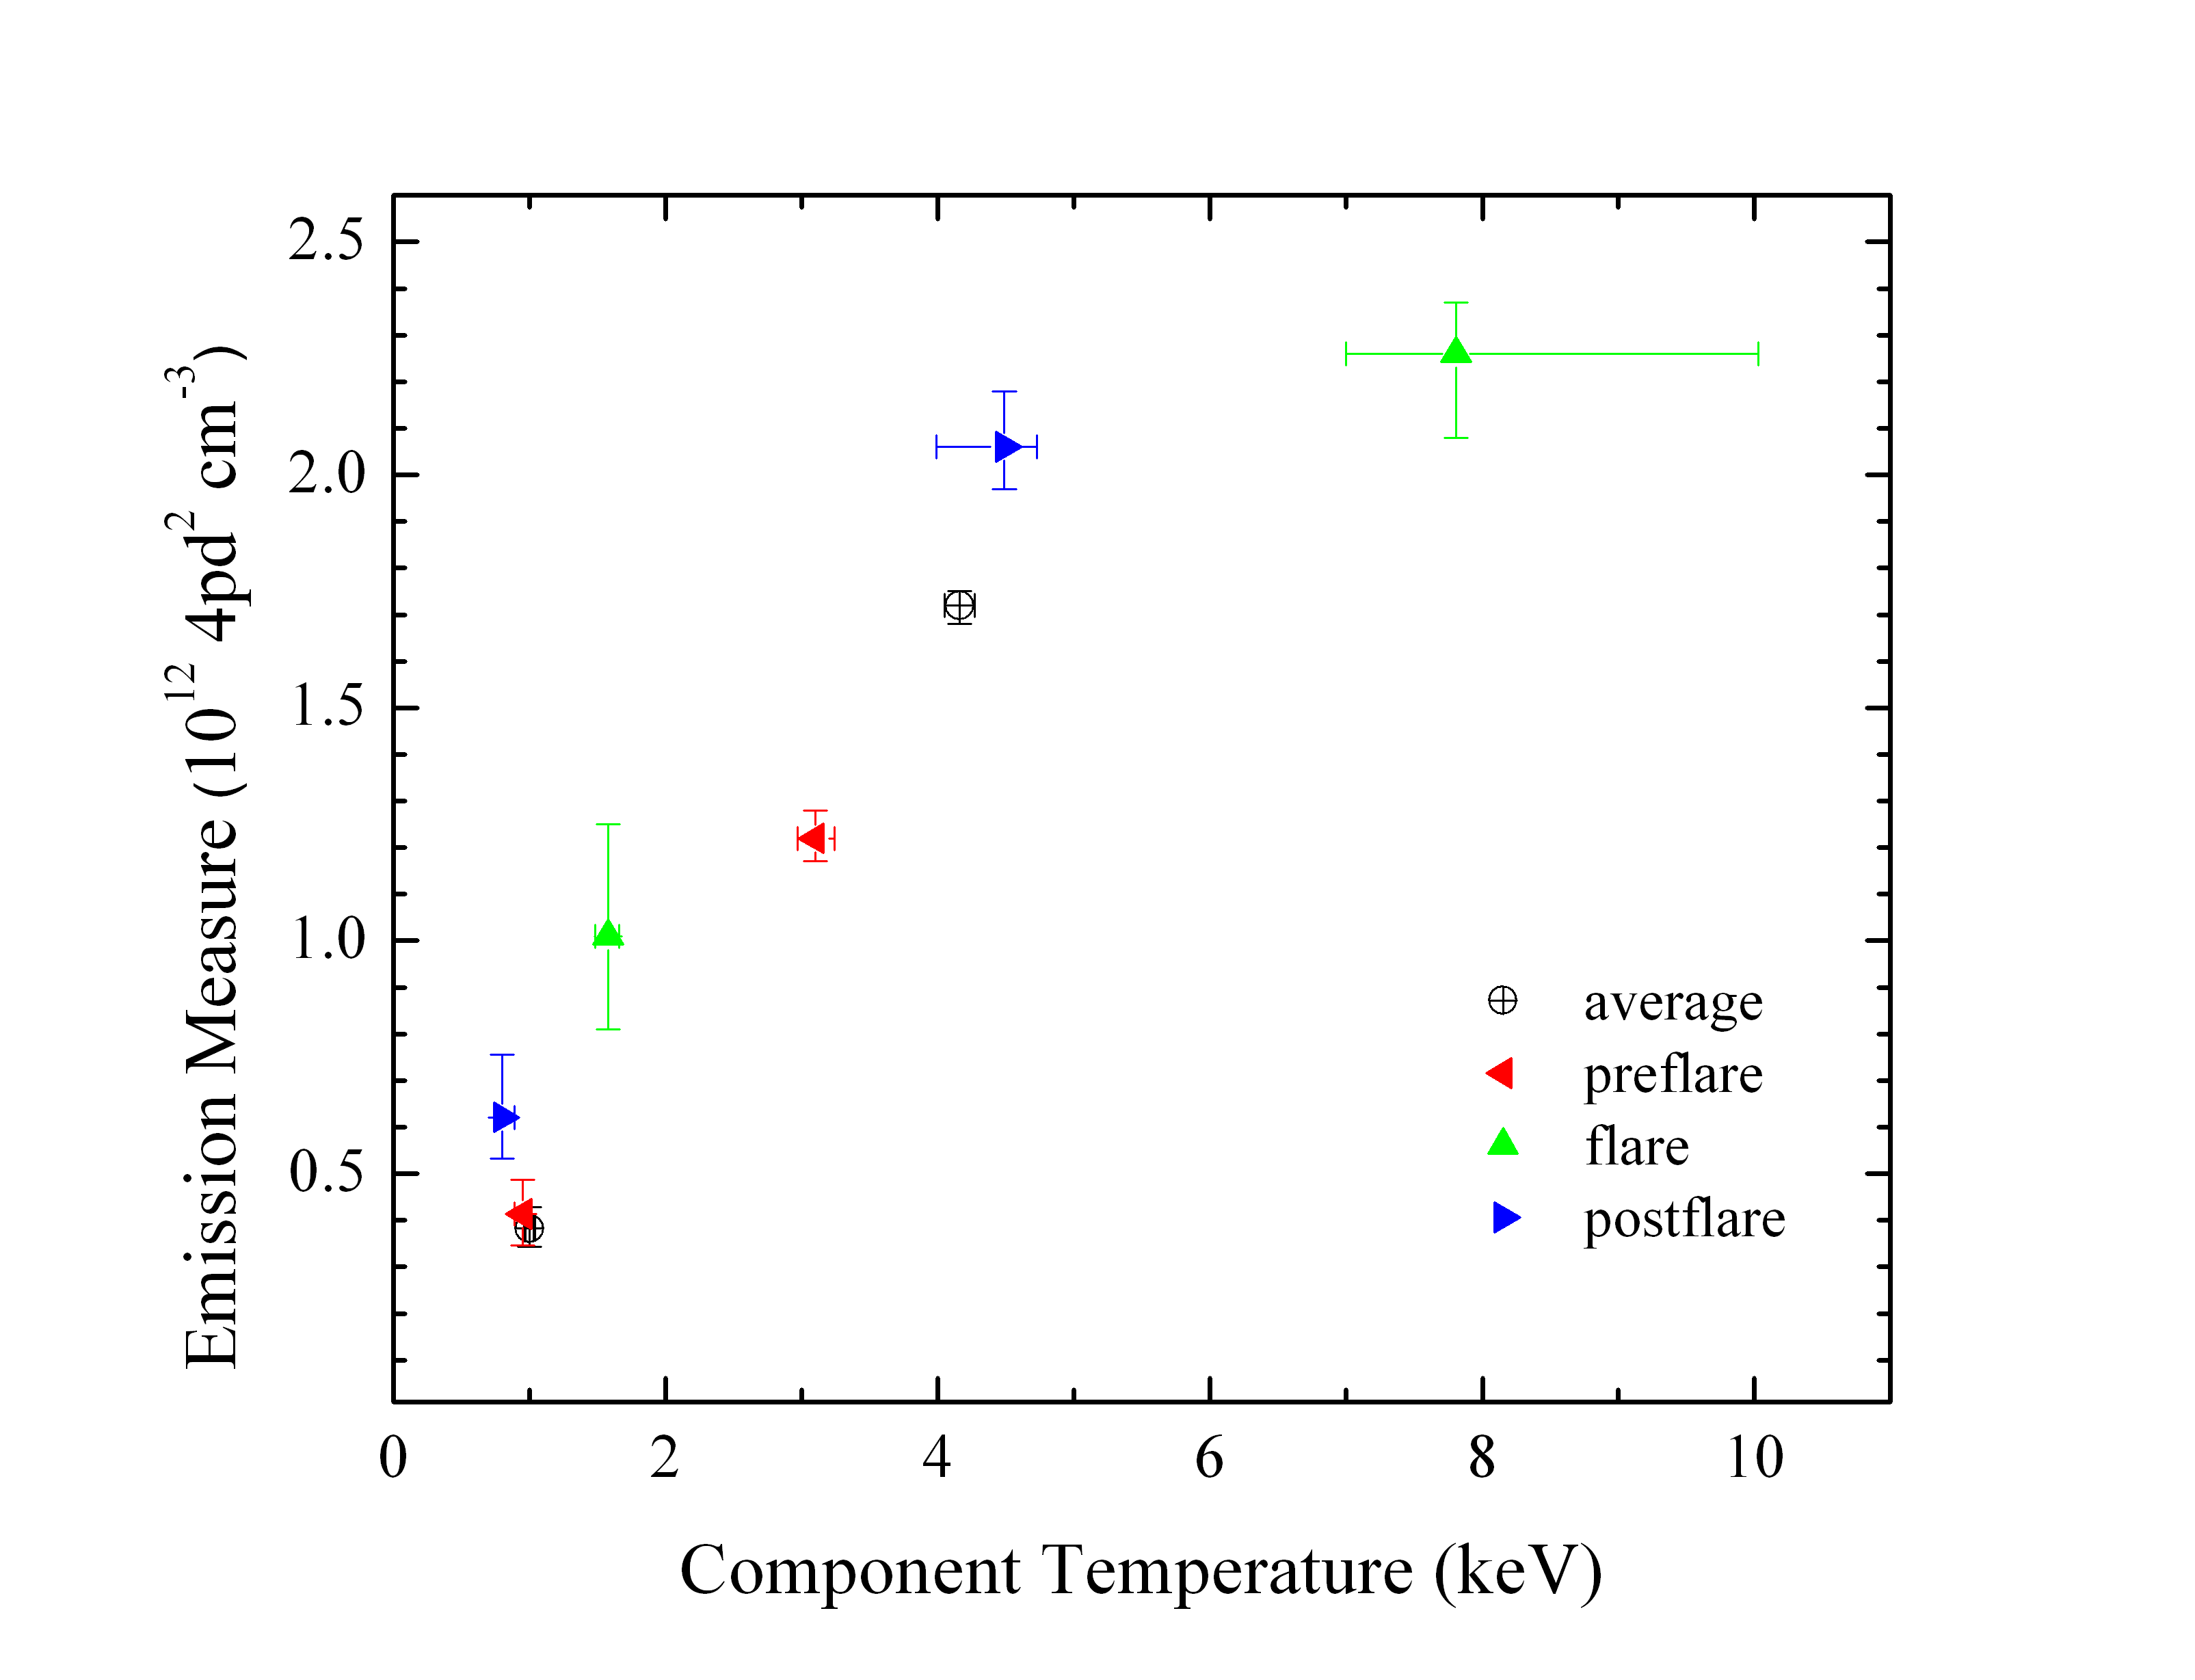
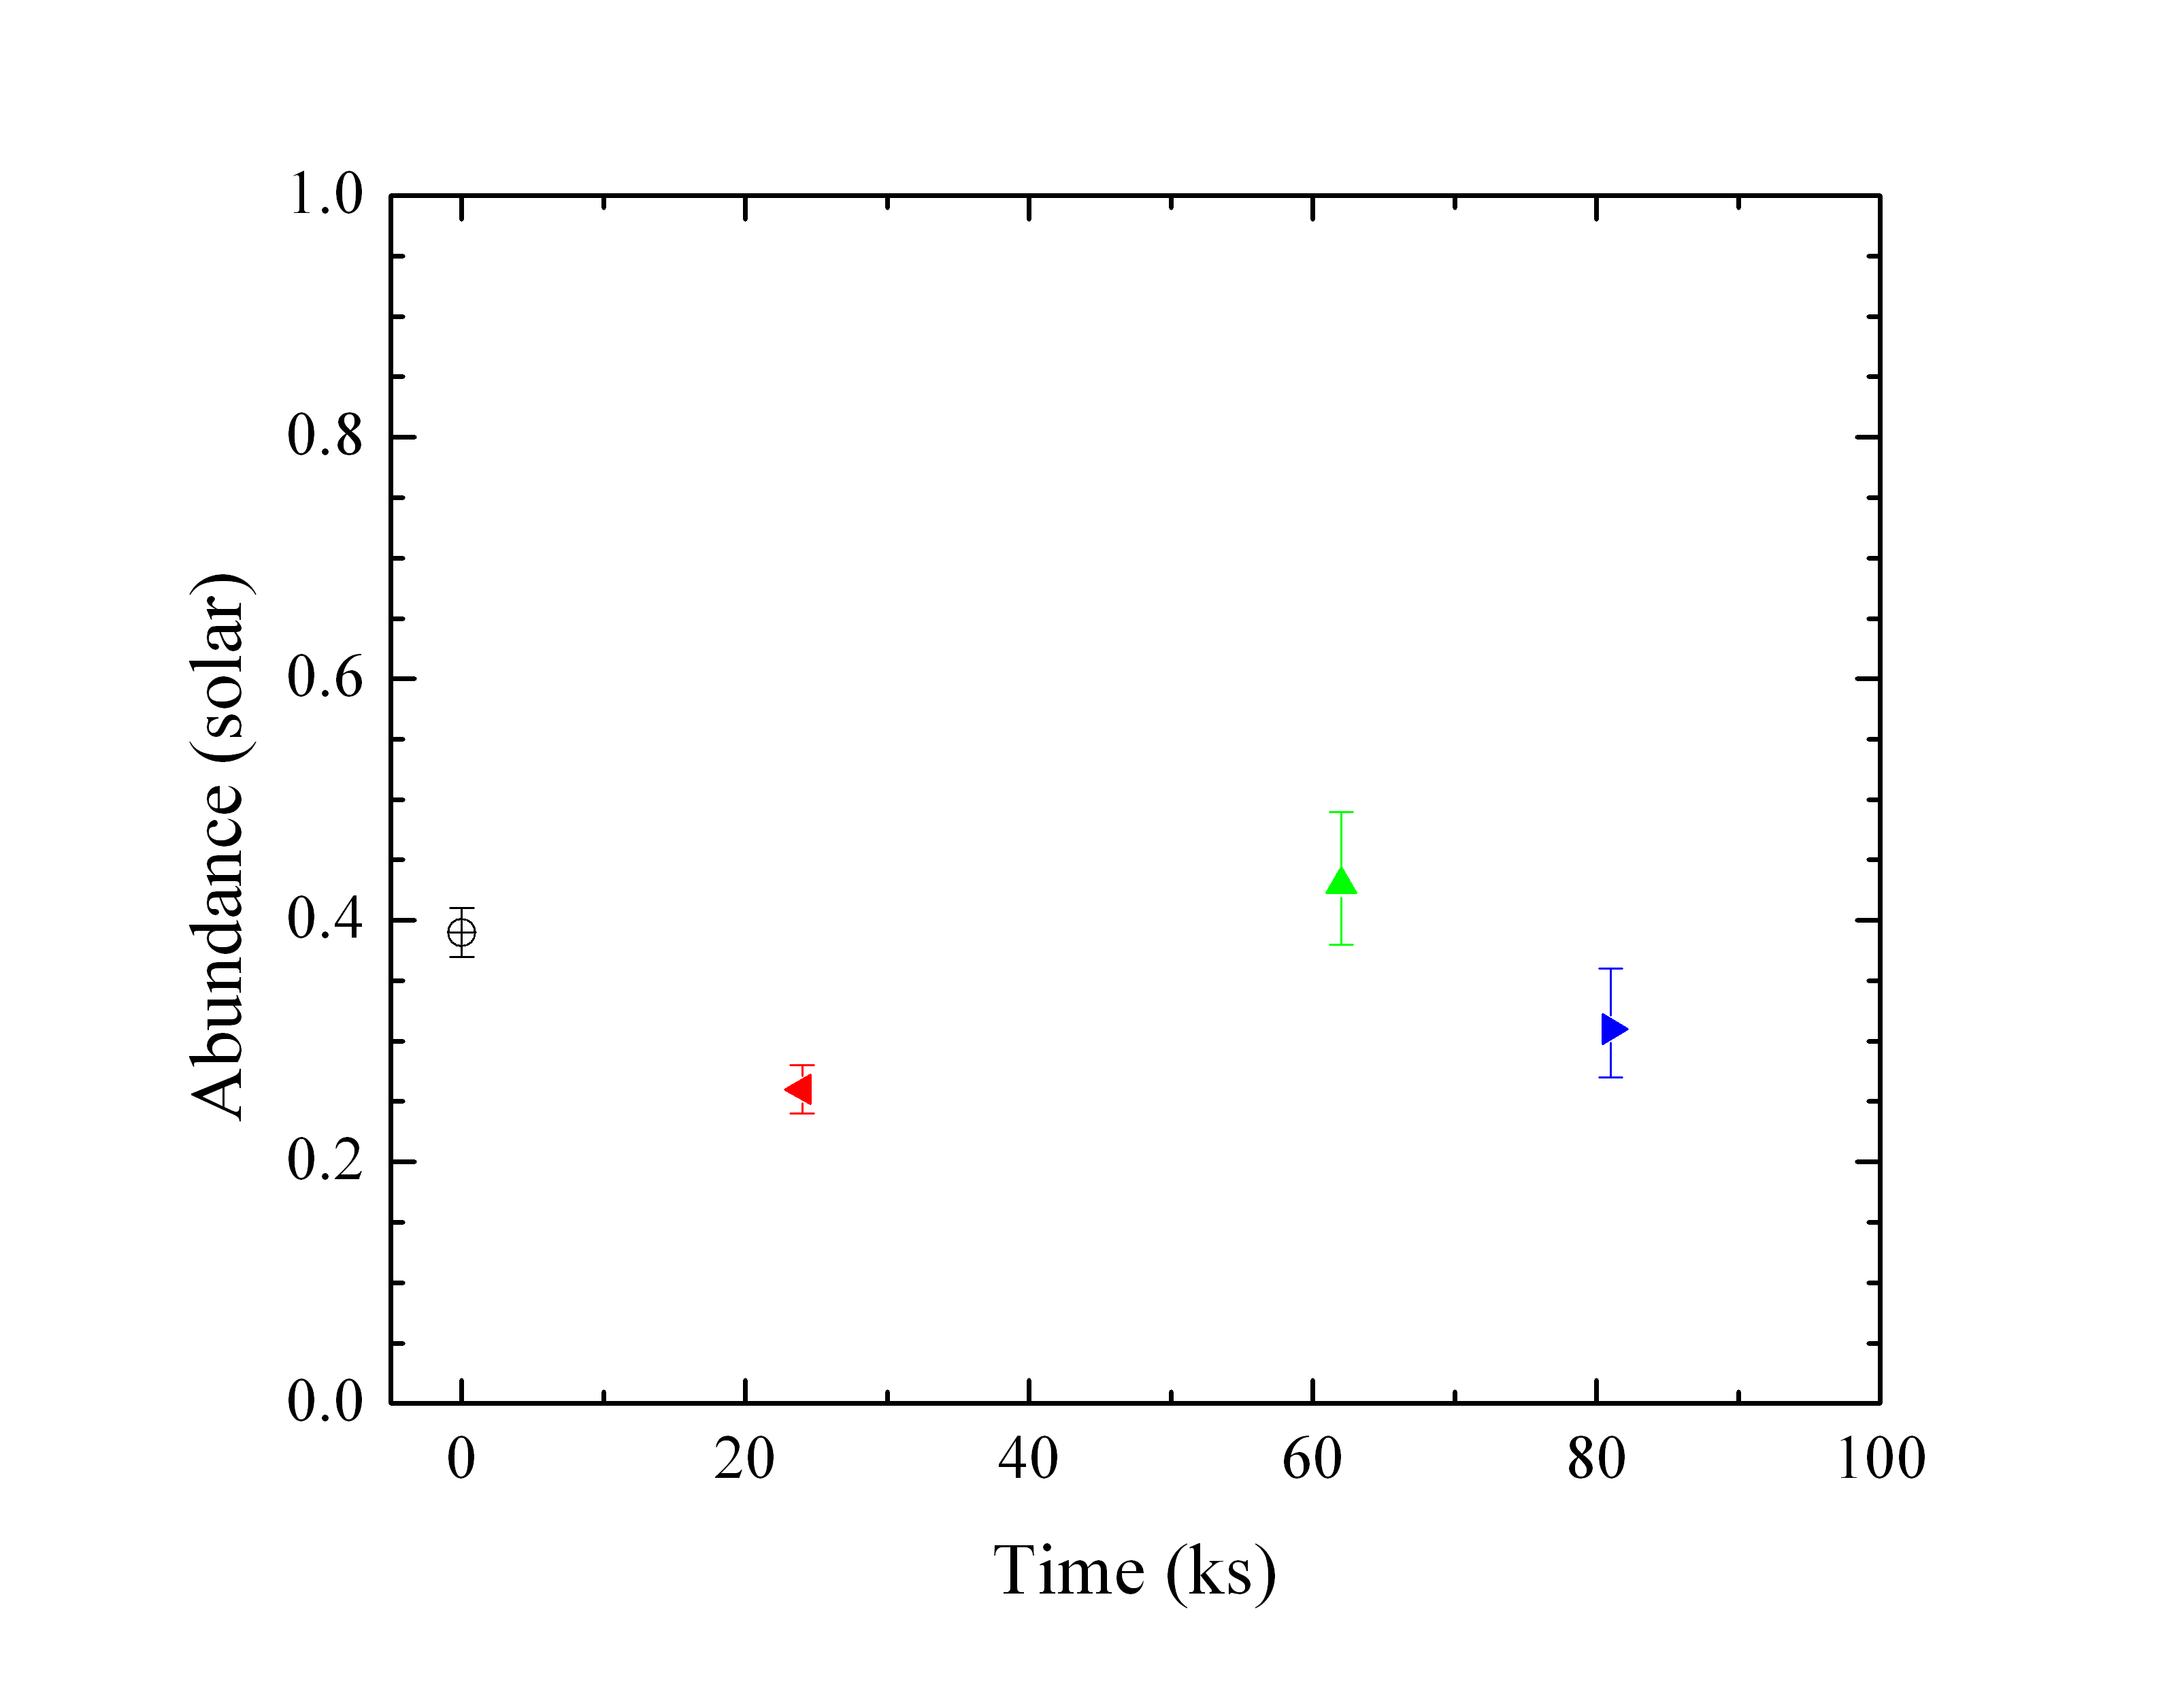
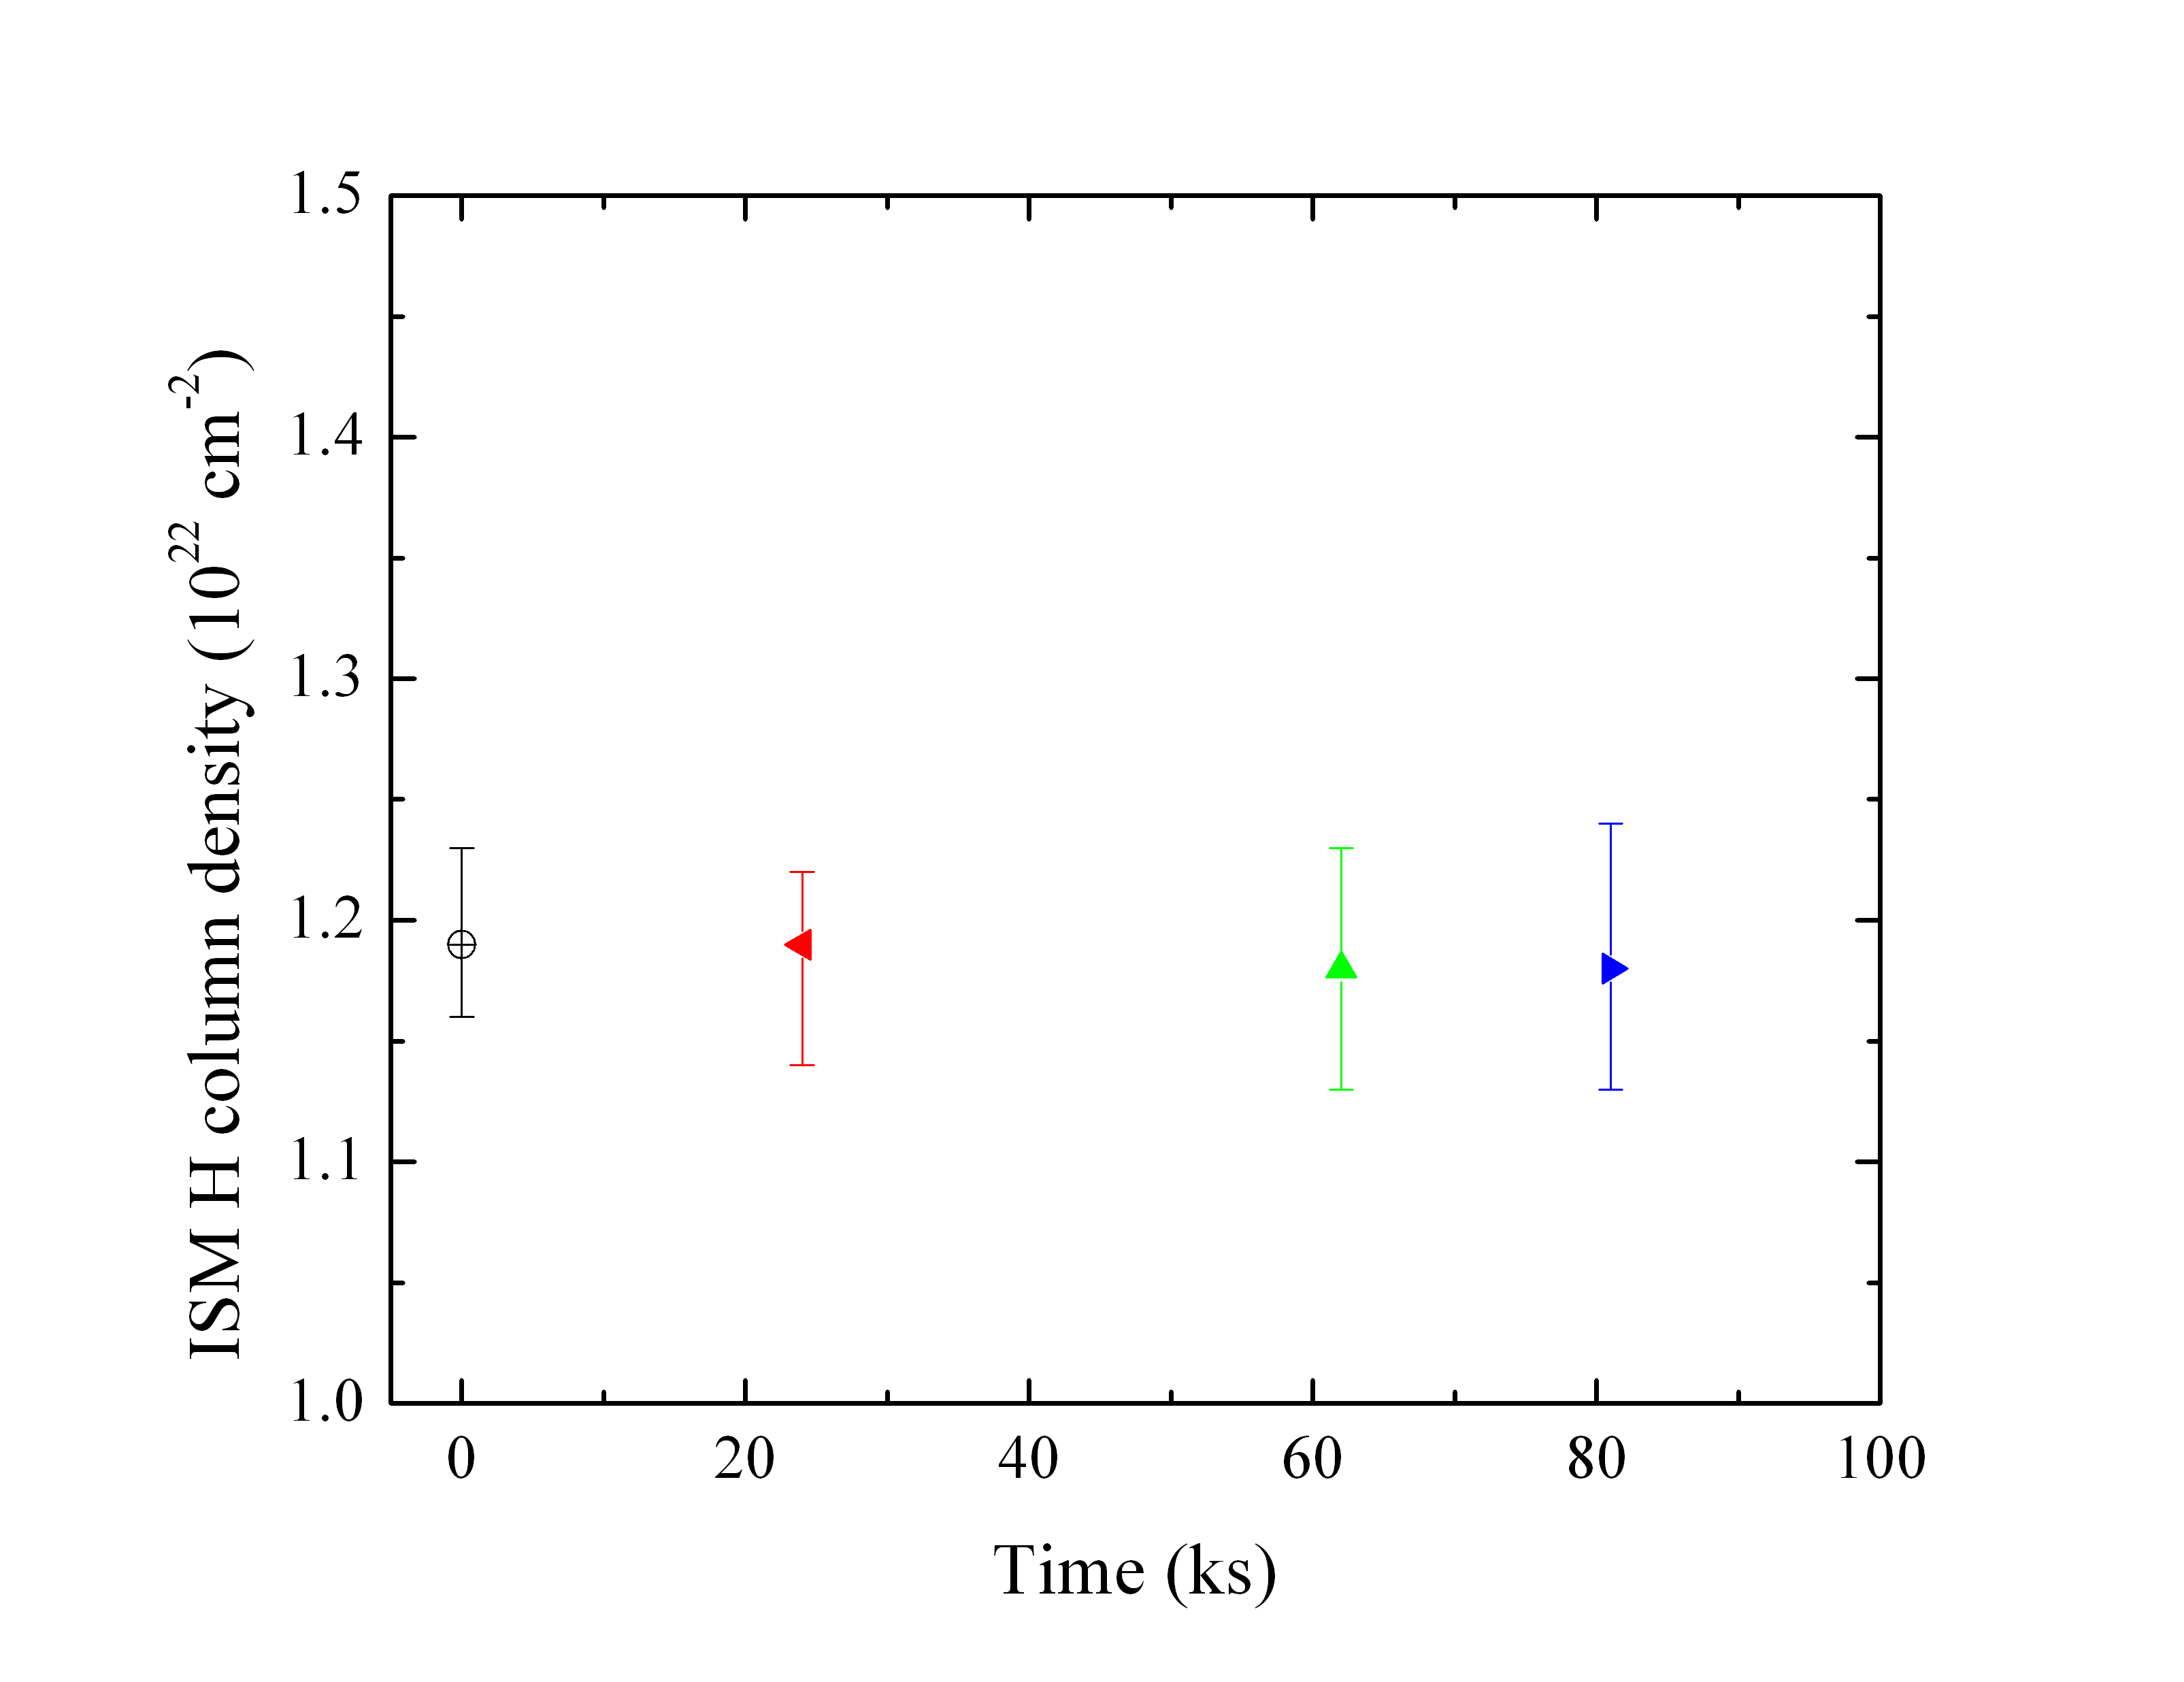
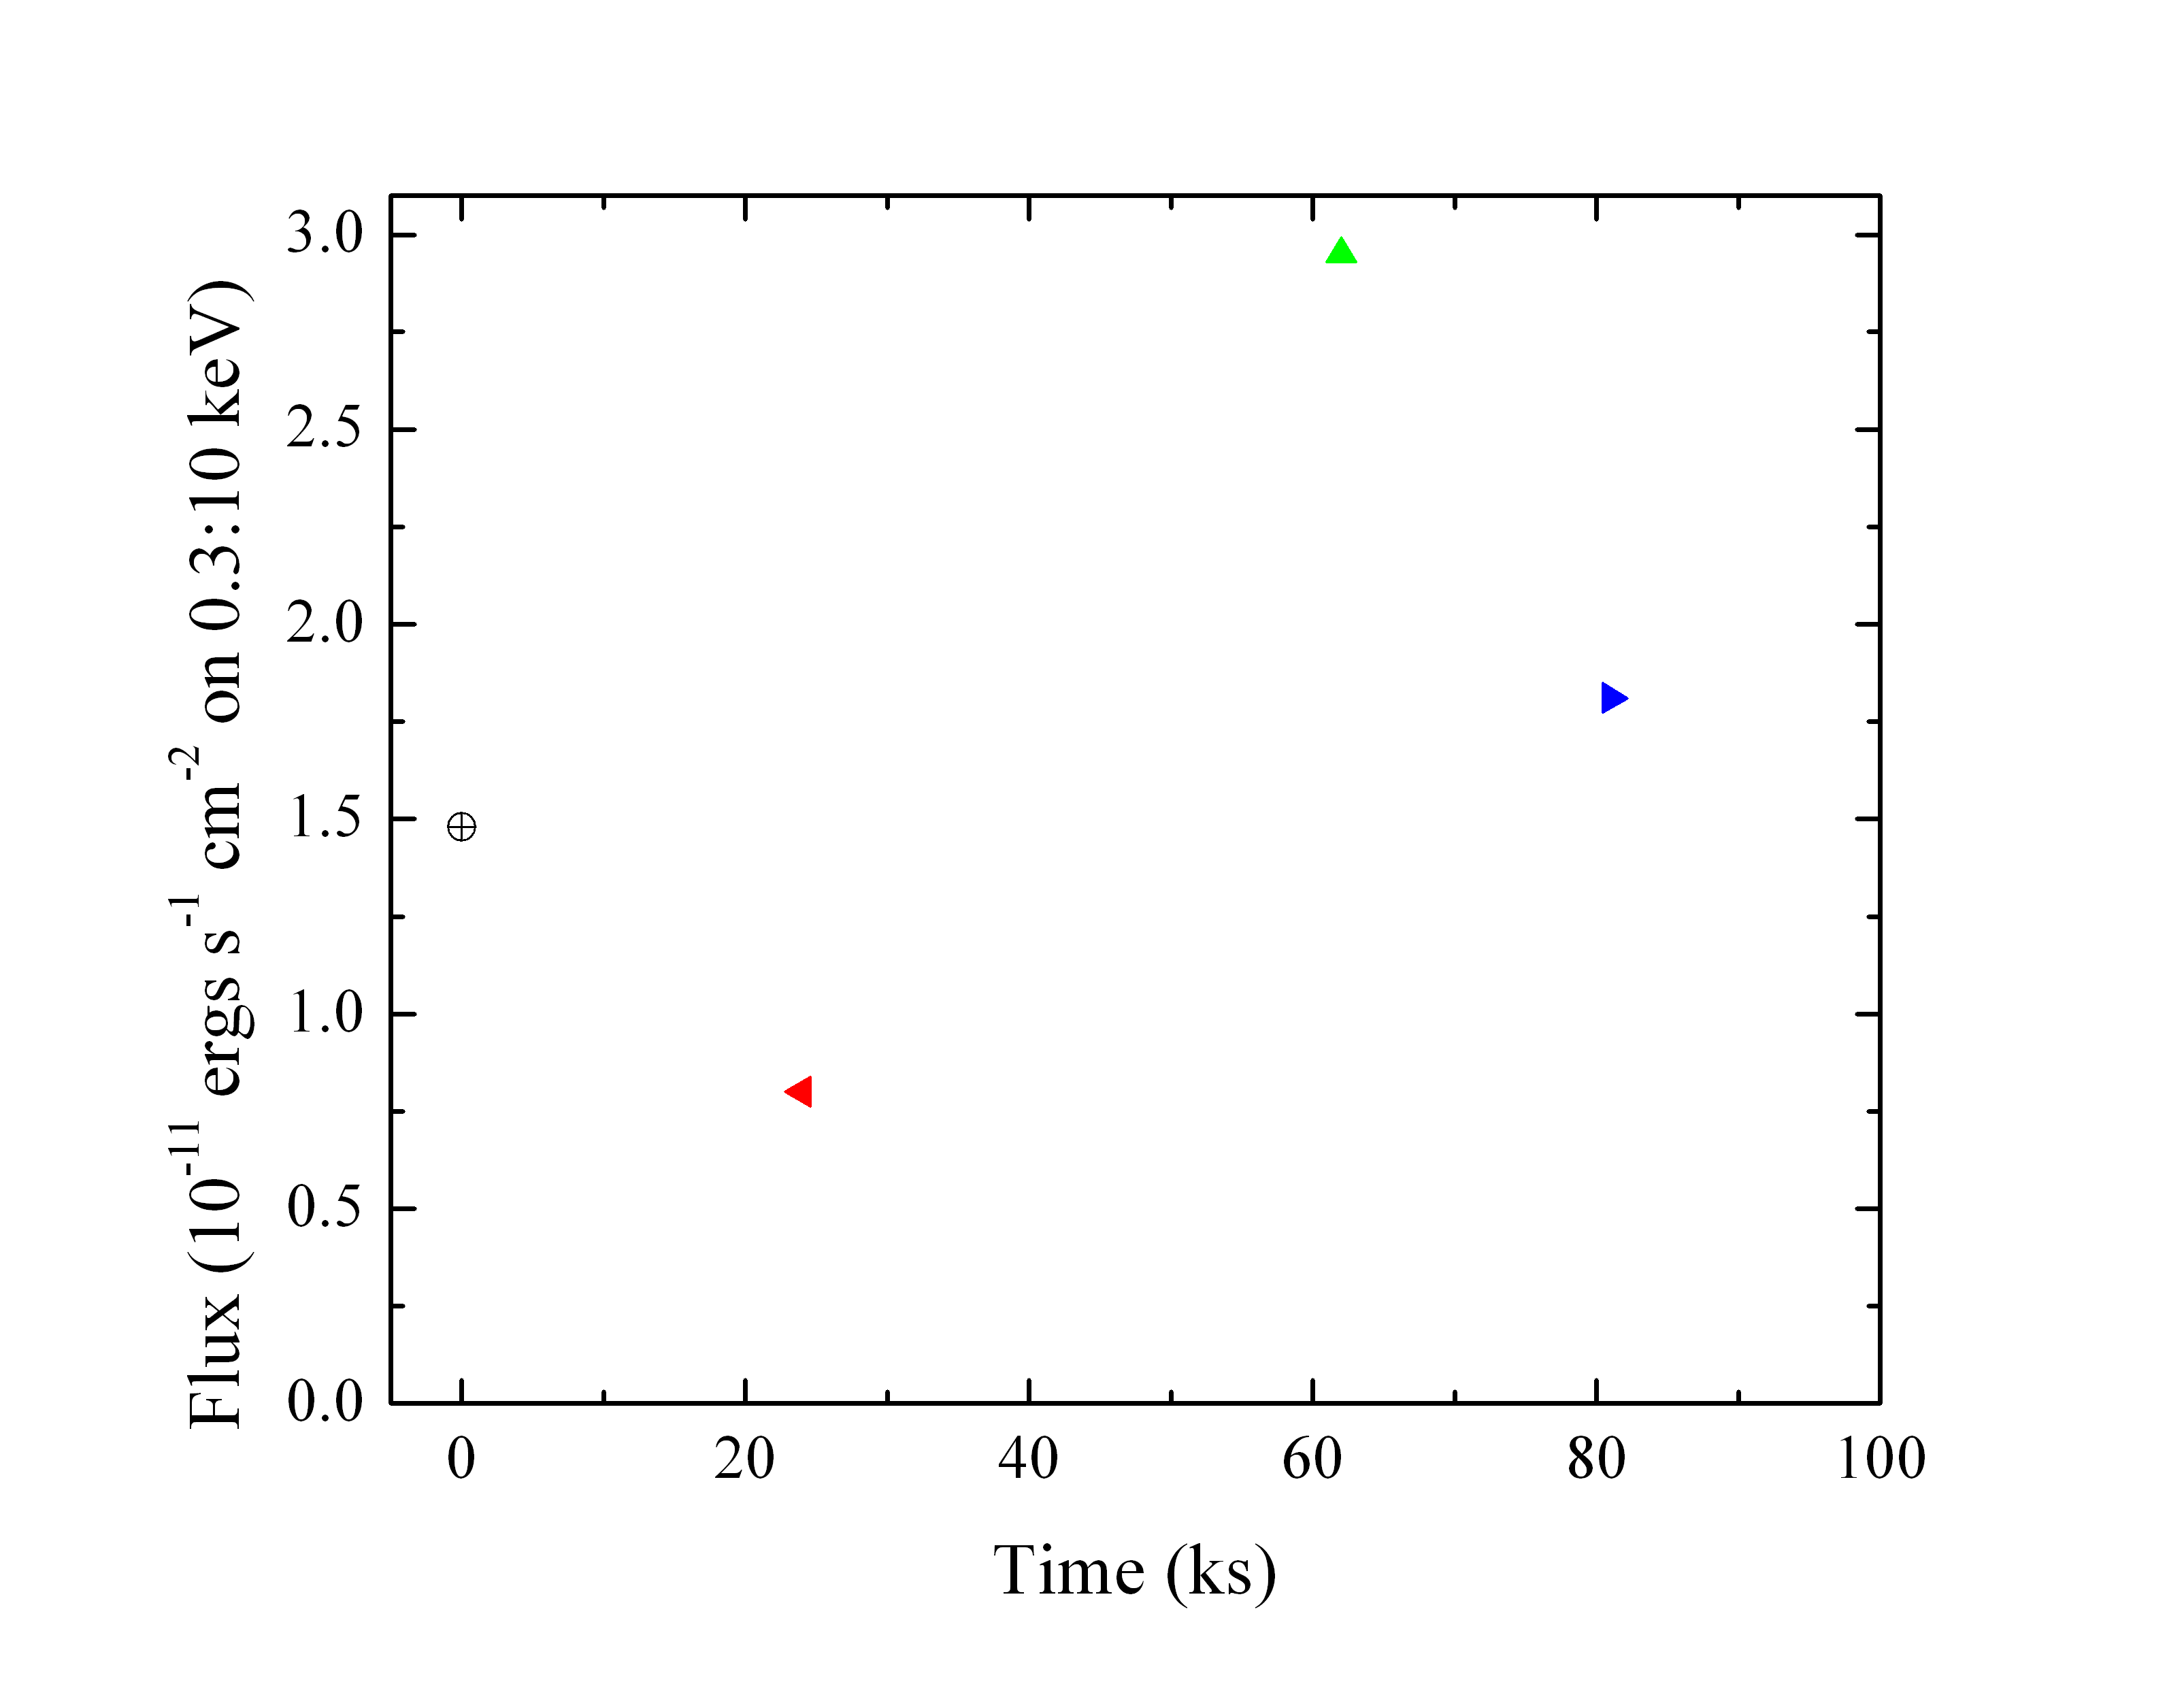
We show two-temperature APEC fits to the entire spectrum, and also fit the preflare, flare, and postflare sections of the data separately. We summarize the results for the temperatures and normalizations, abundance, ISM column density, and flux evolution. We show the X-ray light curve below.

We also can look at the evolution of the hardness ratio.
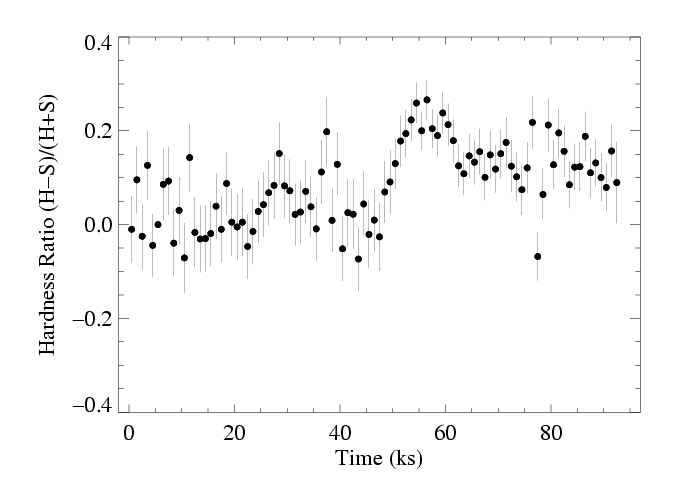
The APEC fitting (MEG and HEG) indicates that the plasma doubles in temperature during the flare. Formally, the hotter of the two components increases from 3 to 8 keV while its normalization increases by about a factor of two. The cooler component changes less, but does get somewhat hotter. The post-flare section is less well fit by the two-temperature model, but its spectral properties and derived APEC model parameters are closer to those of the flare than to the pre-flare sections. The derived ISM column density does not change appreciably from one phase of the observation to the next. There is marginal evidence for a correlation between metallicity and plasma temperature.
We fit the same types of models to spectra formed from the three subsections of the observation indicated by the vertical lines in the light curve plot. The results are linked above, and we provide the links again here:
Pre-flare analysis
Flare analysis
Post-flare analysis
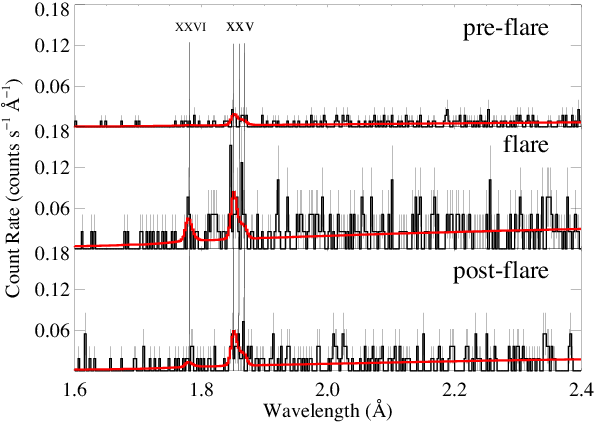
The increased temperature during (and to some extent after) the flare can also be seen in the iron K complex (H-like iron (Fe XXVI) at 1.78 Angstroms and He-like iron (Fe XXV) at 1.85-1.87 Angstroms):
last modified: 6 May 2009